kernel function的核心是,只要我们对整个空间给定一个对距离相关性的度量标准,那么我们因为这个度量标准可以推测出别处的数据(可能的)分布。
机器学习里的 kernel 是指什么? - 知乎 https://www.zhihu.com/question/30371867
kernel function的核心是,只要我们对整个空间给定一个对距离相关性的度量标准,那么我们因为这个度量标准可以推测出别处的数据(可能的)分布。
机器学习里的 kernel 是指什么? - 知乎 https://www.zhihu.com/question/30371867
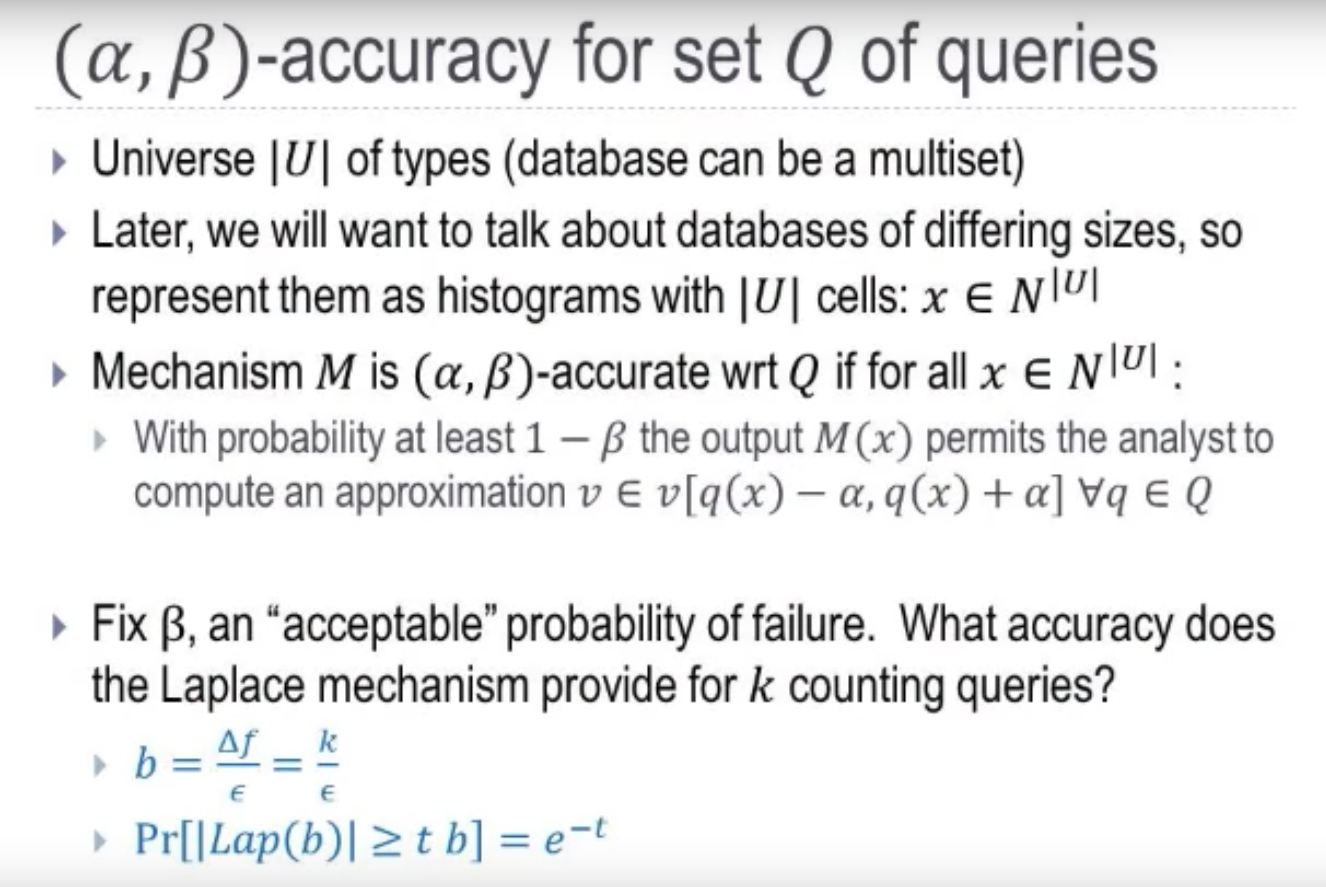
- $P(|x|\ge tb)=e^{-t}$
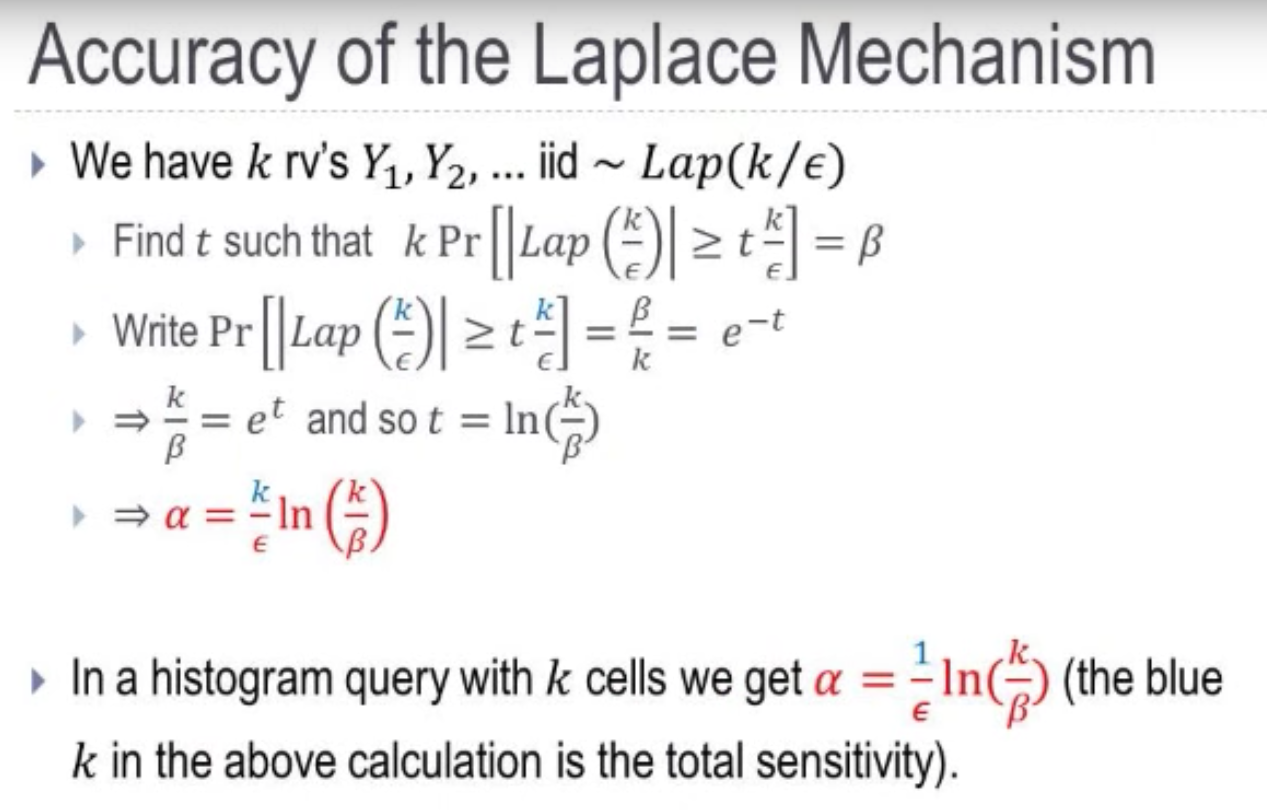
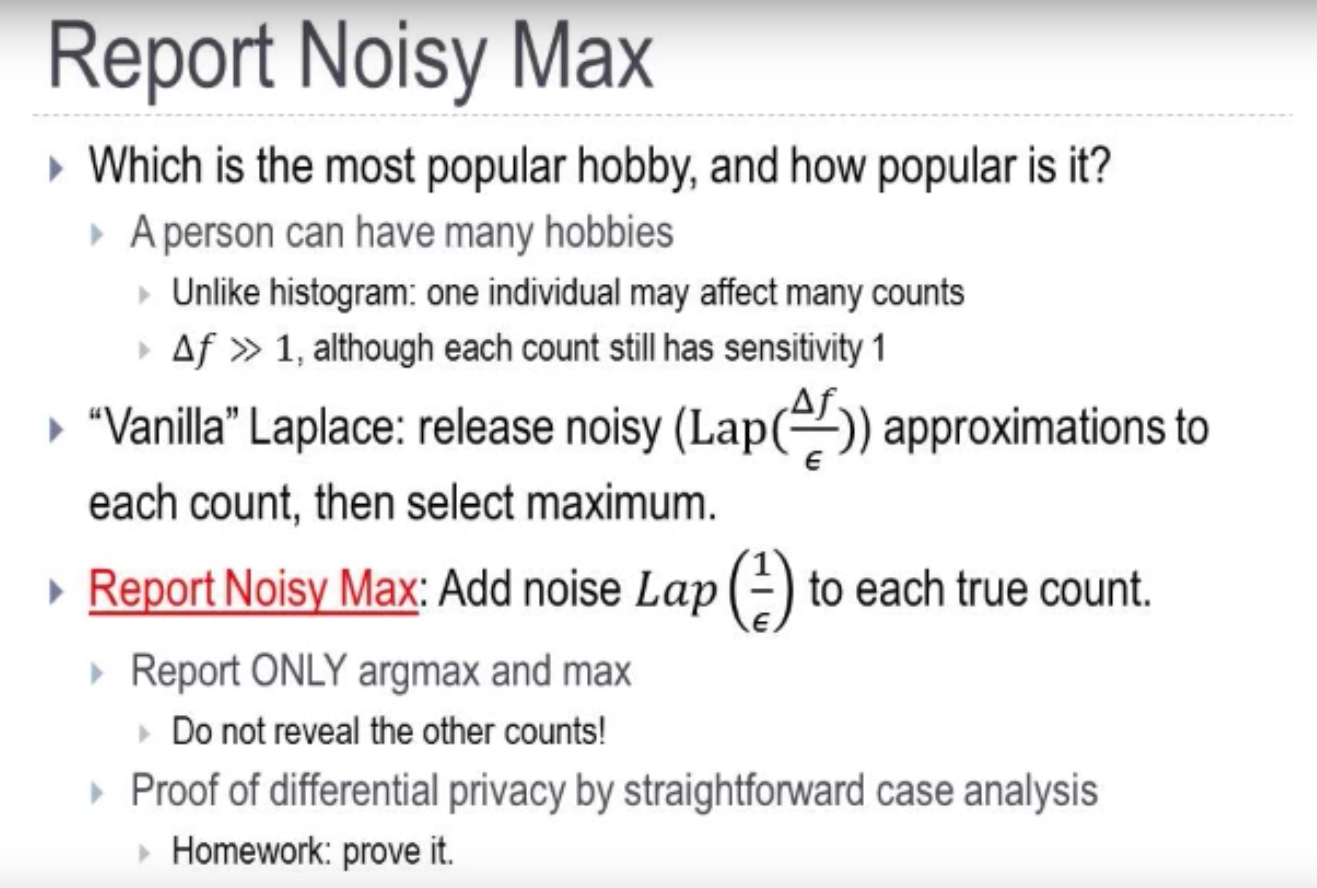
x
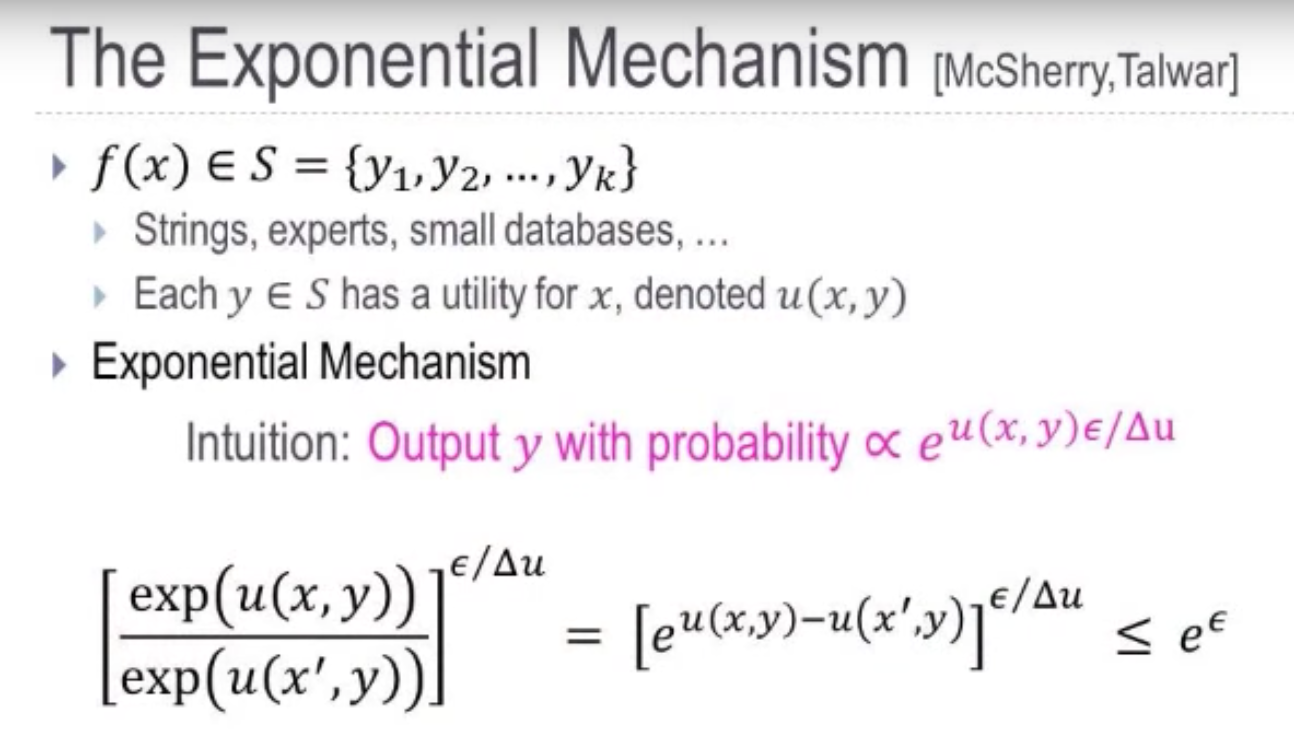
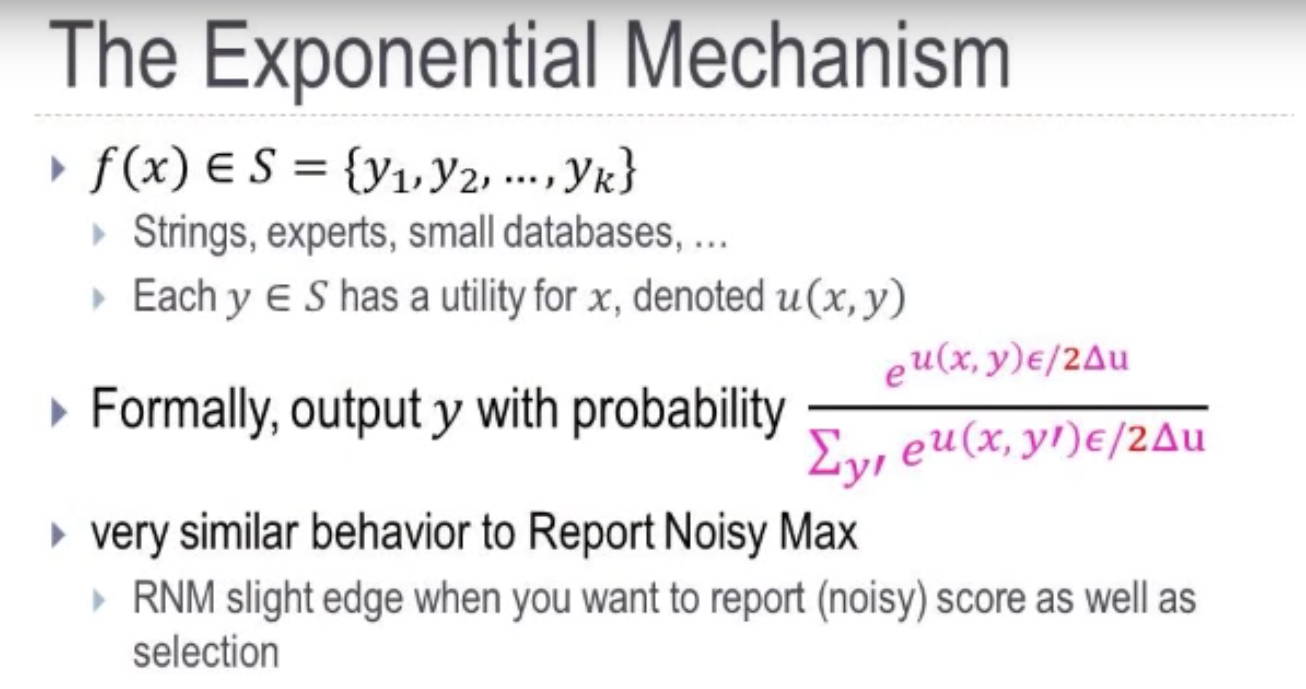
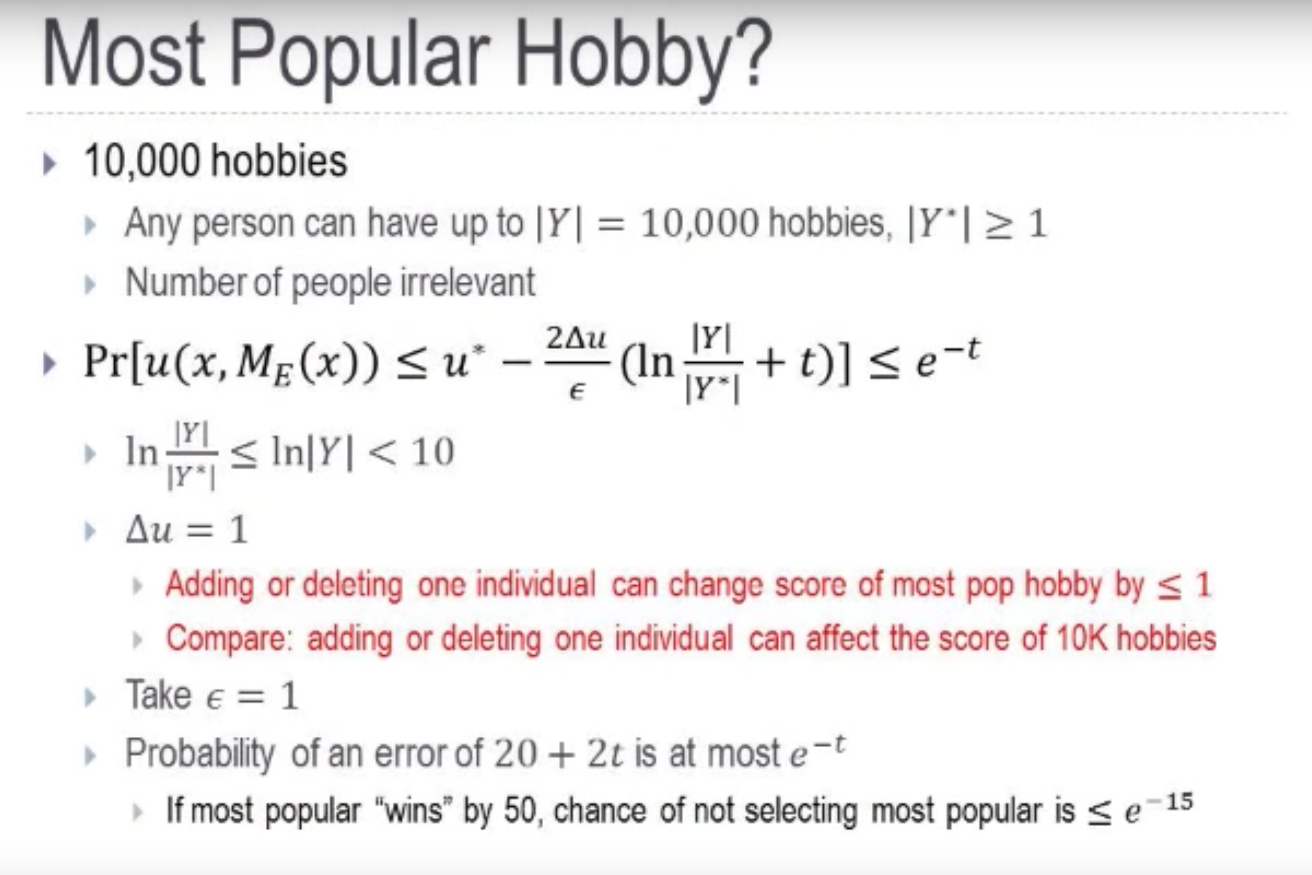
sensitivity of utility $\Delta u$: how much in the worst case can one person’s data affect the ytility.
xx
.png)
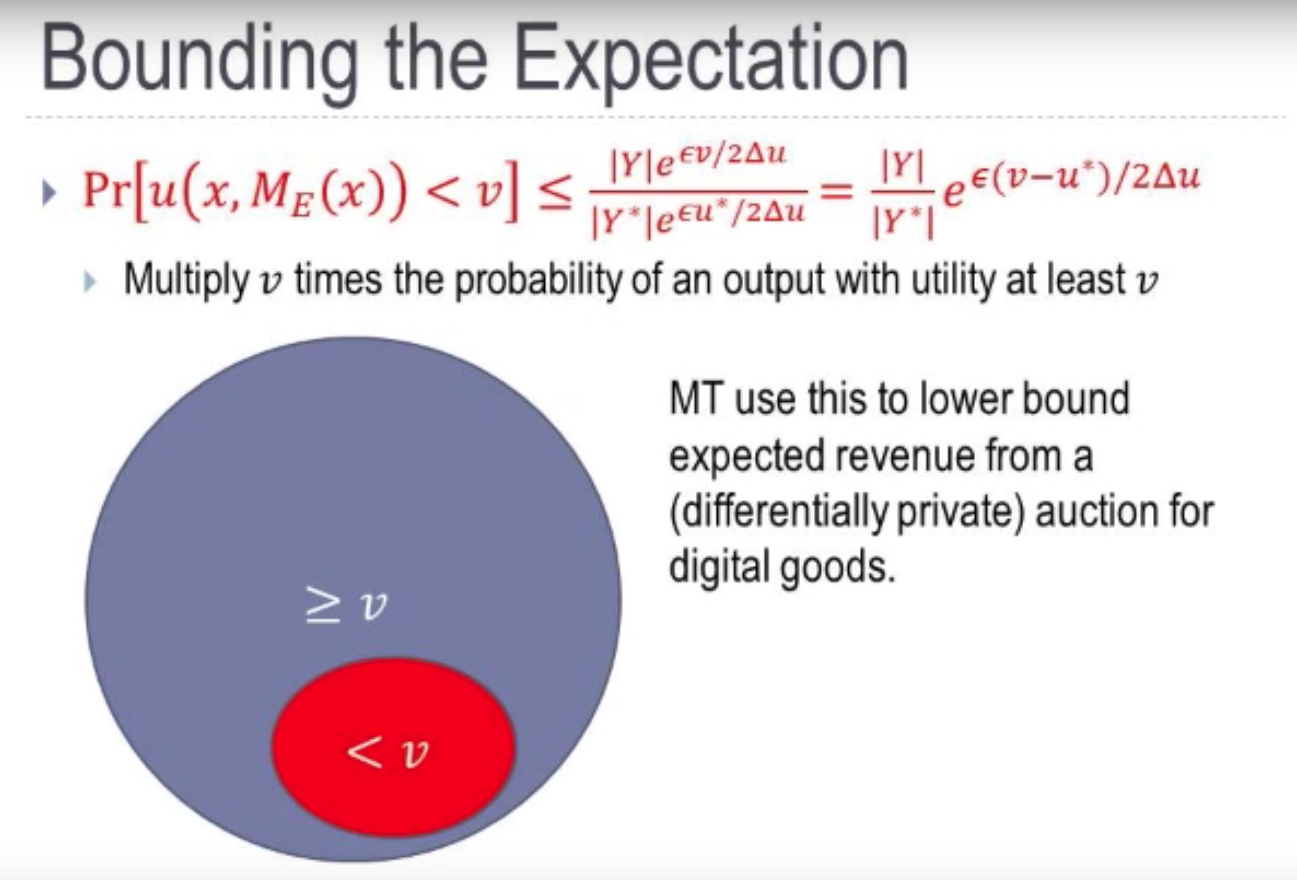
- for the utility above, $u(x,y)$, it is defined according to the query error between the databases; if the query error is small, then should have a good utility, that’s why we need a negative sign in front of the max.
- the sensitivity of utility????
.png)
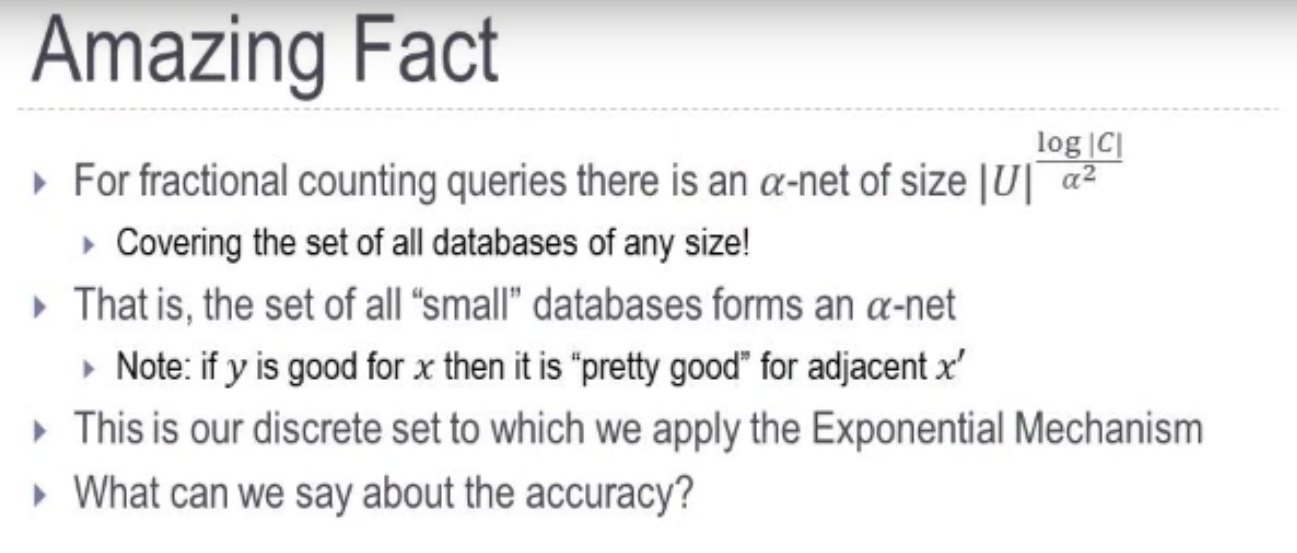
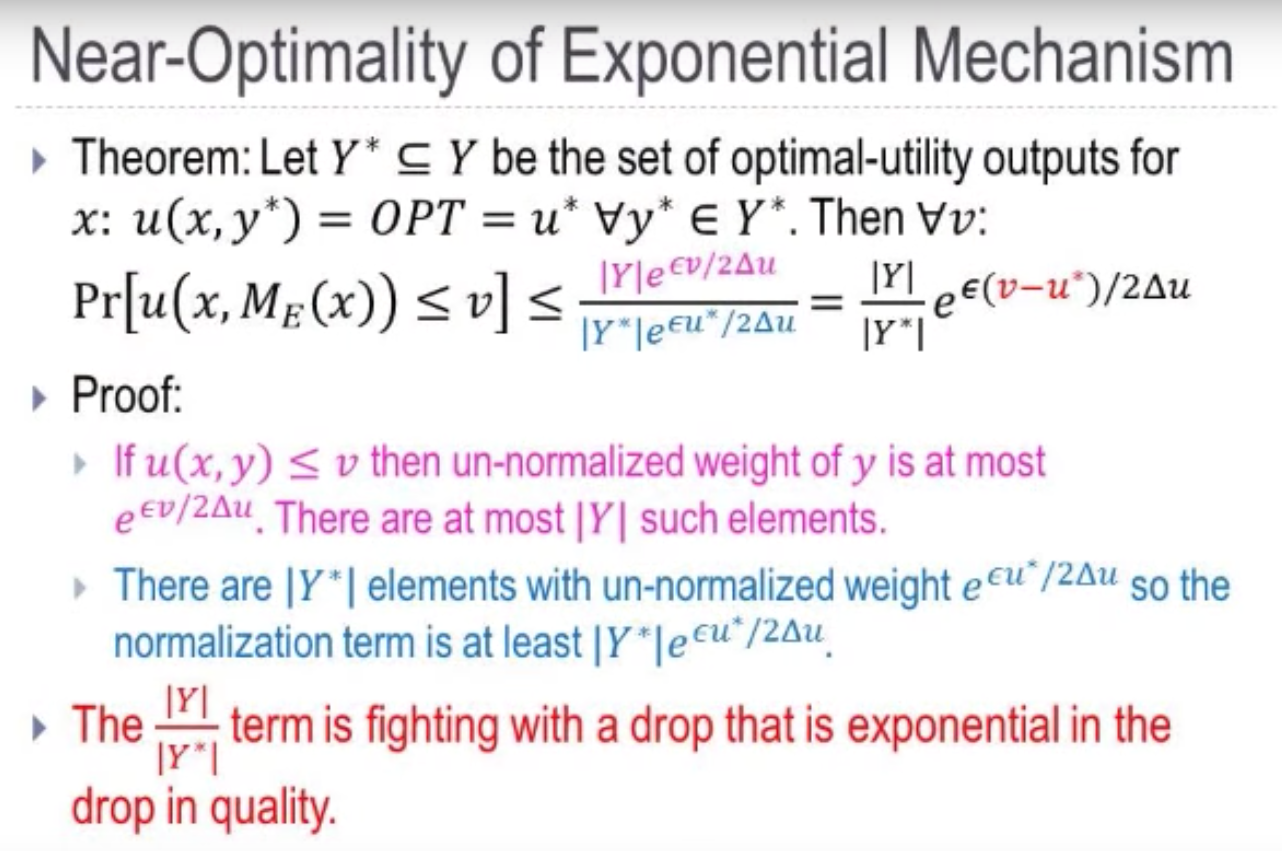
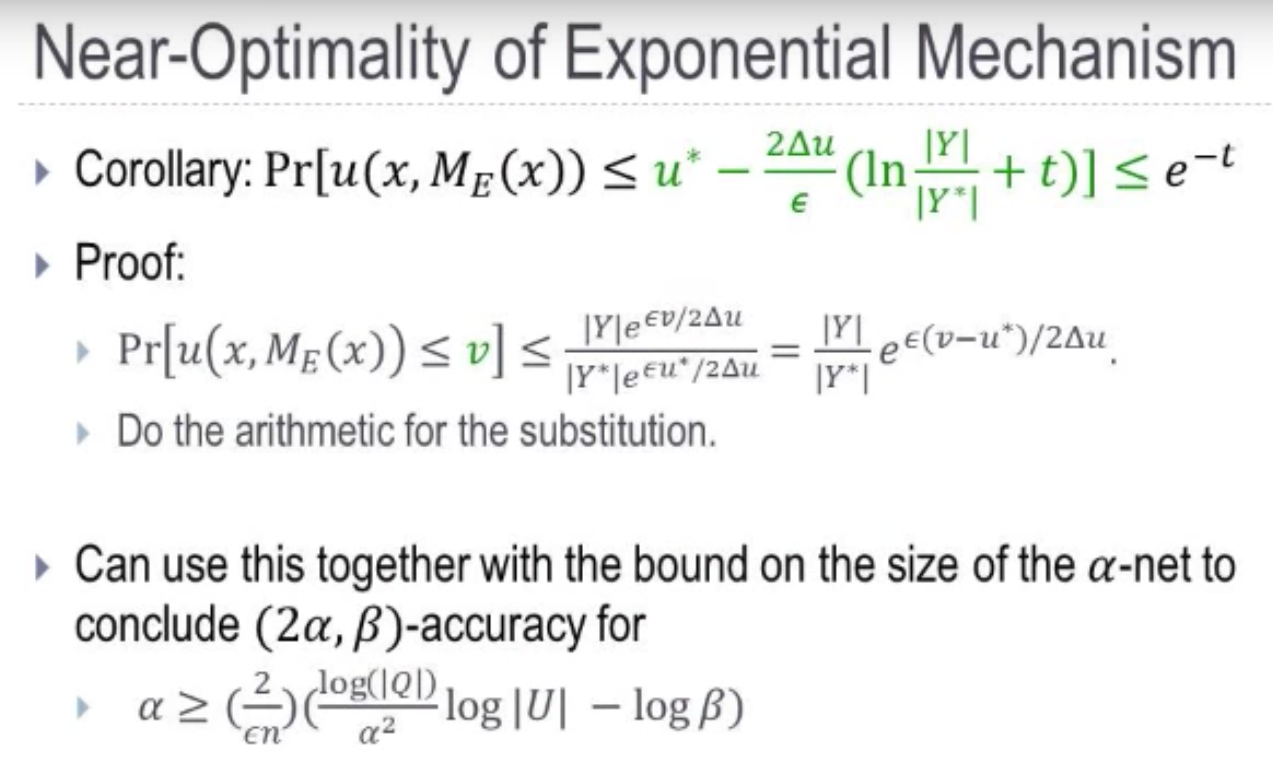
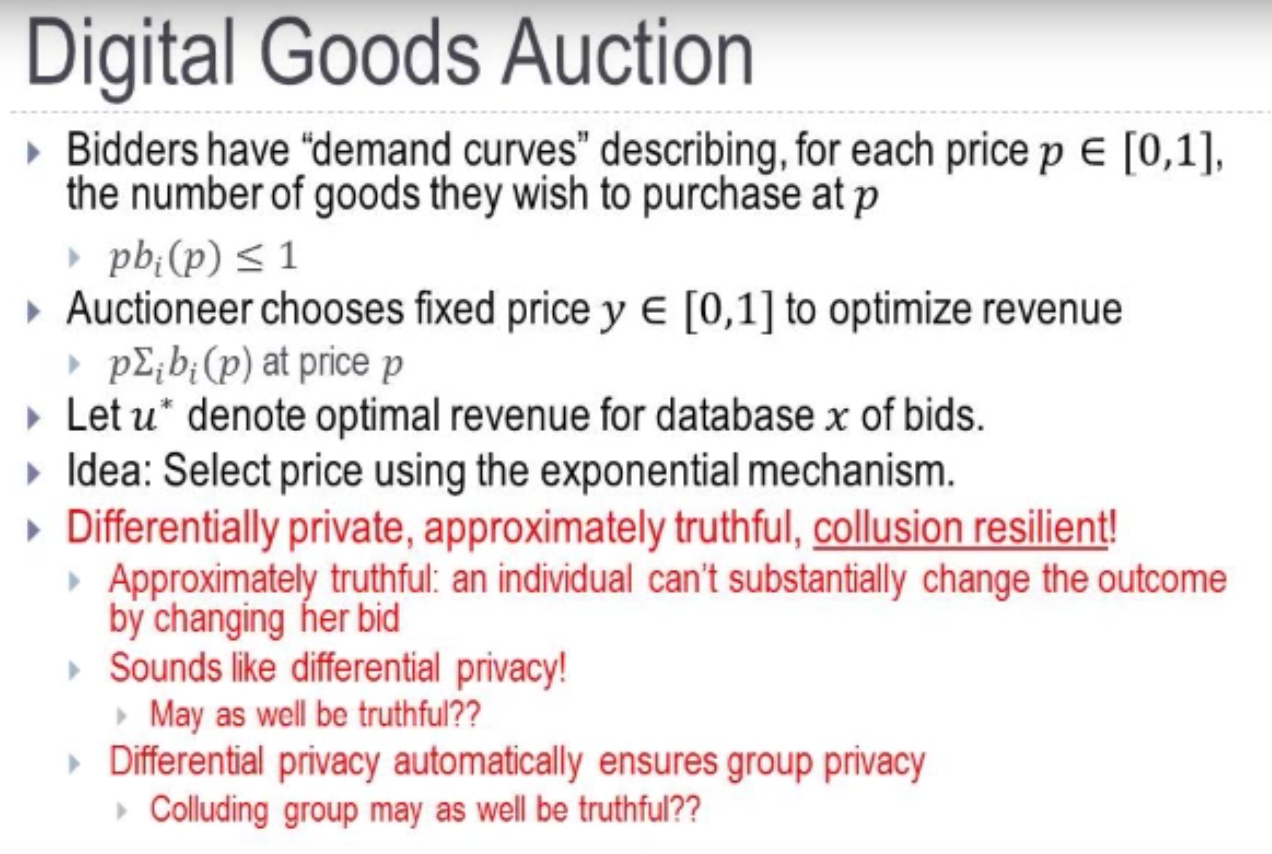
- In the video, she says the mechanism should be saperated from the database????
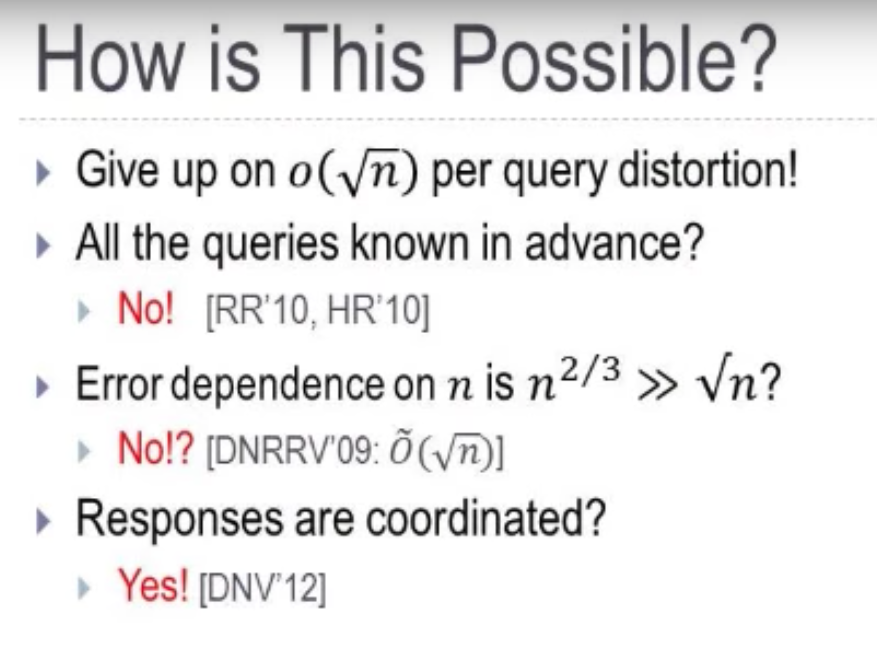
- uncoordinated responses: ask one question and I add some nosie to the true answer and return it to you ; ask another question and do the same thing. They are independent of everything I did in the past.
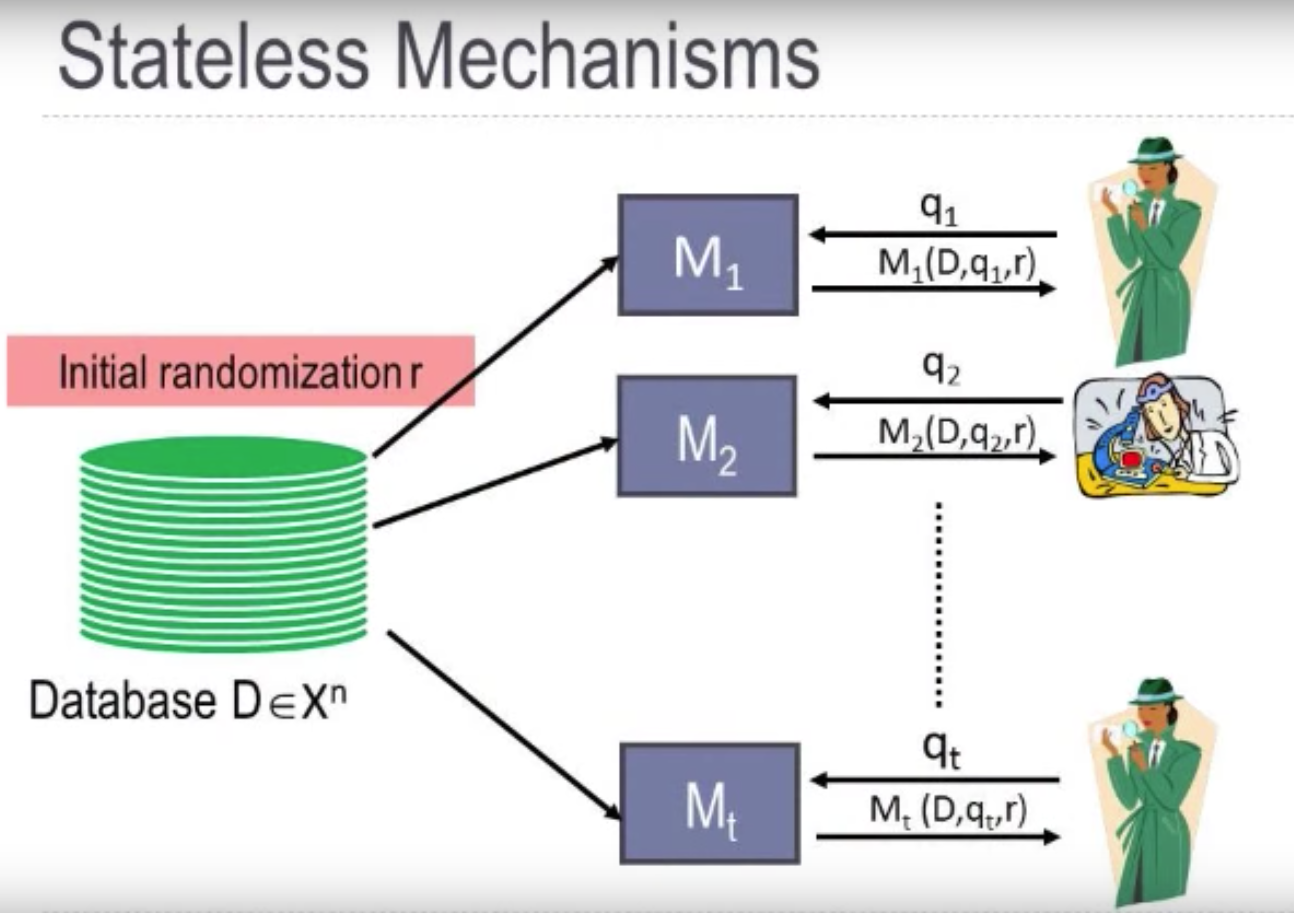
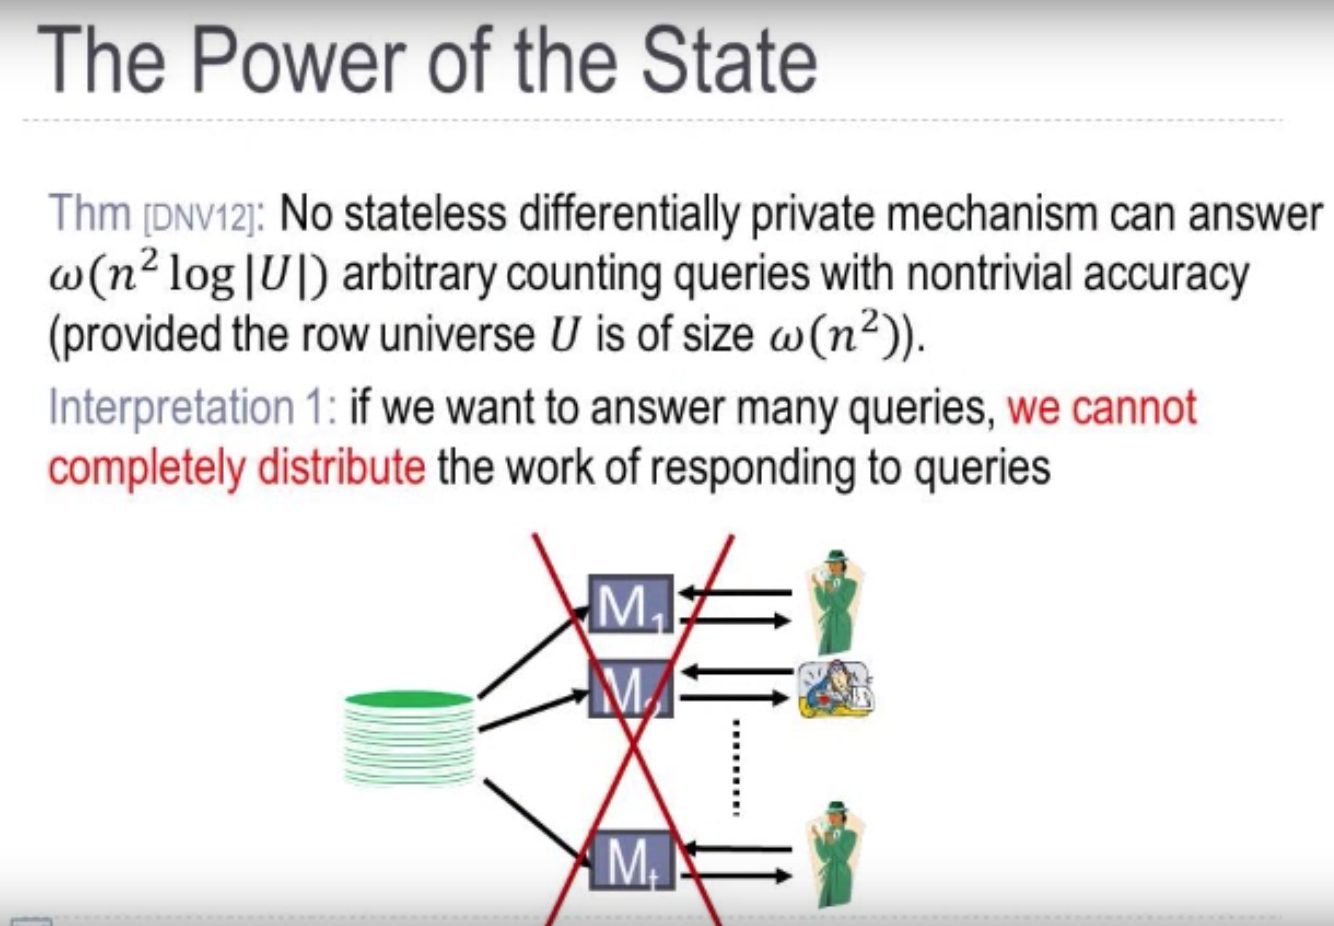
- Stateless Mechanism : it does not remember what it does before. Answering the subsequent queries doesn’t depend on the previous queries.
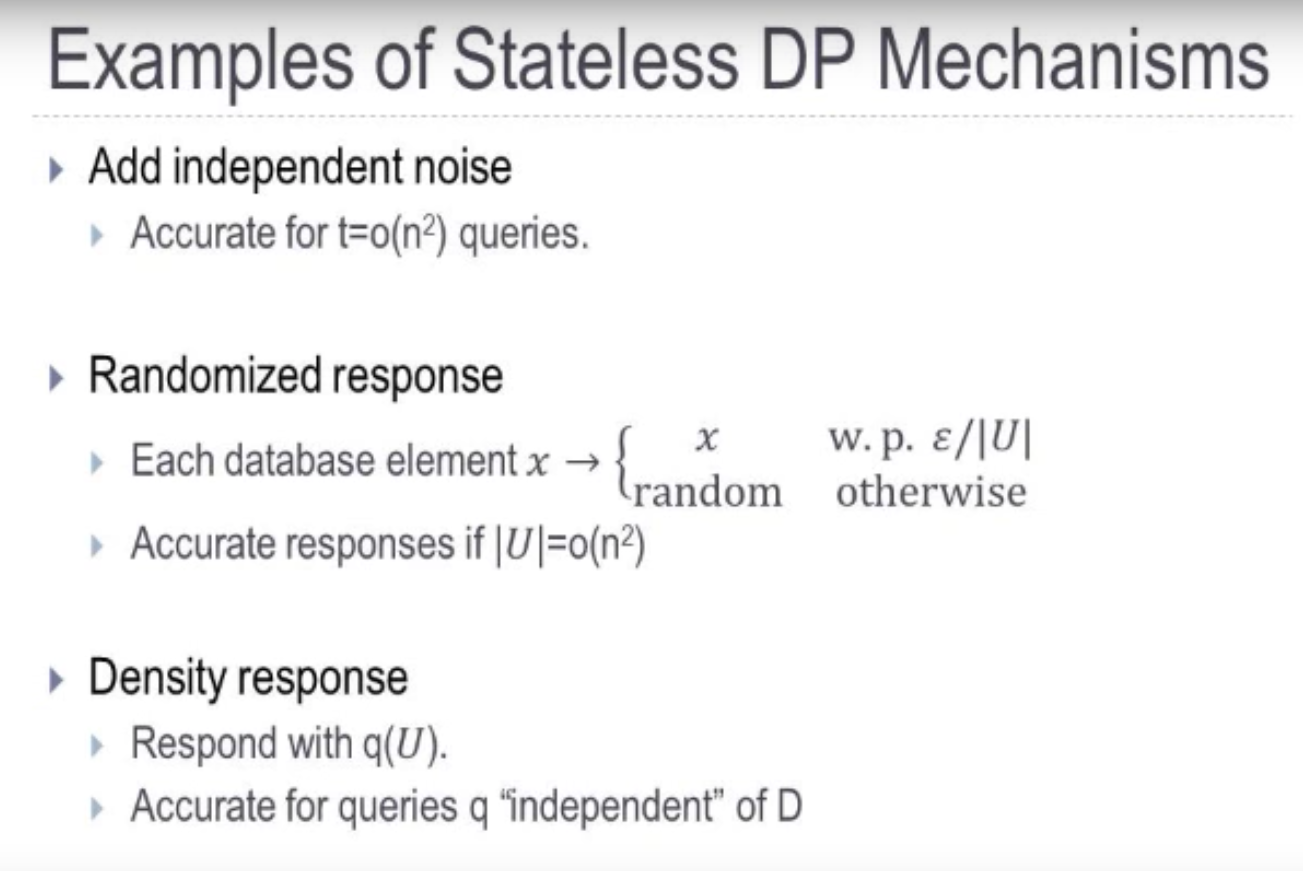
- density response?????
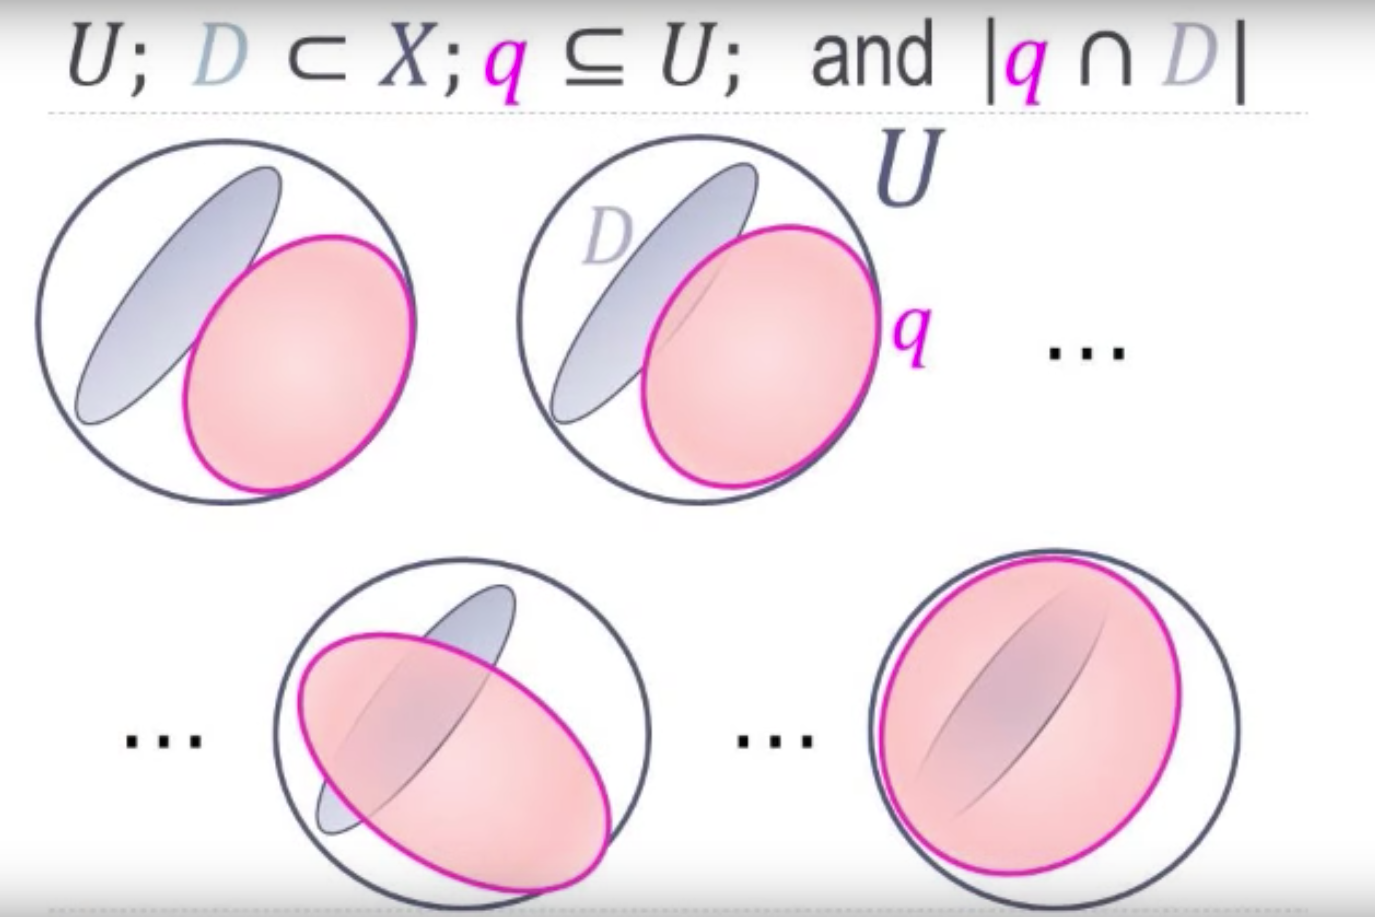
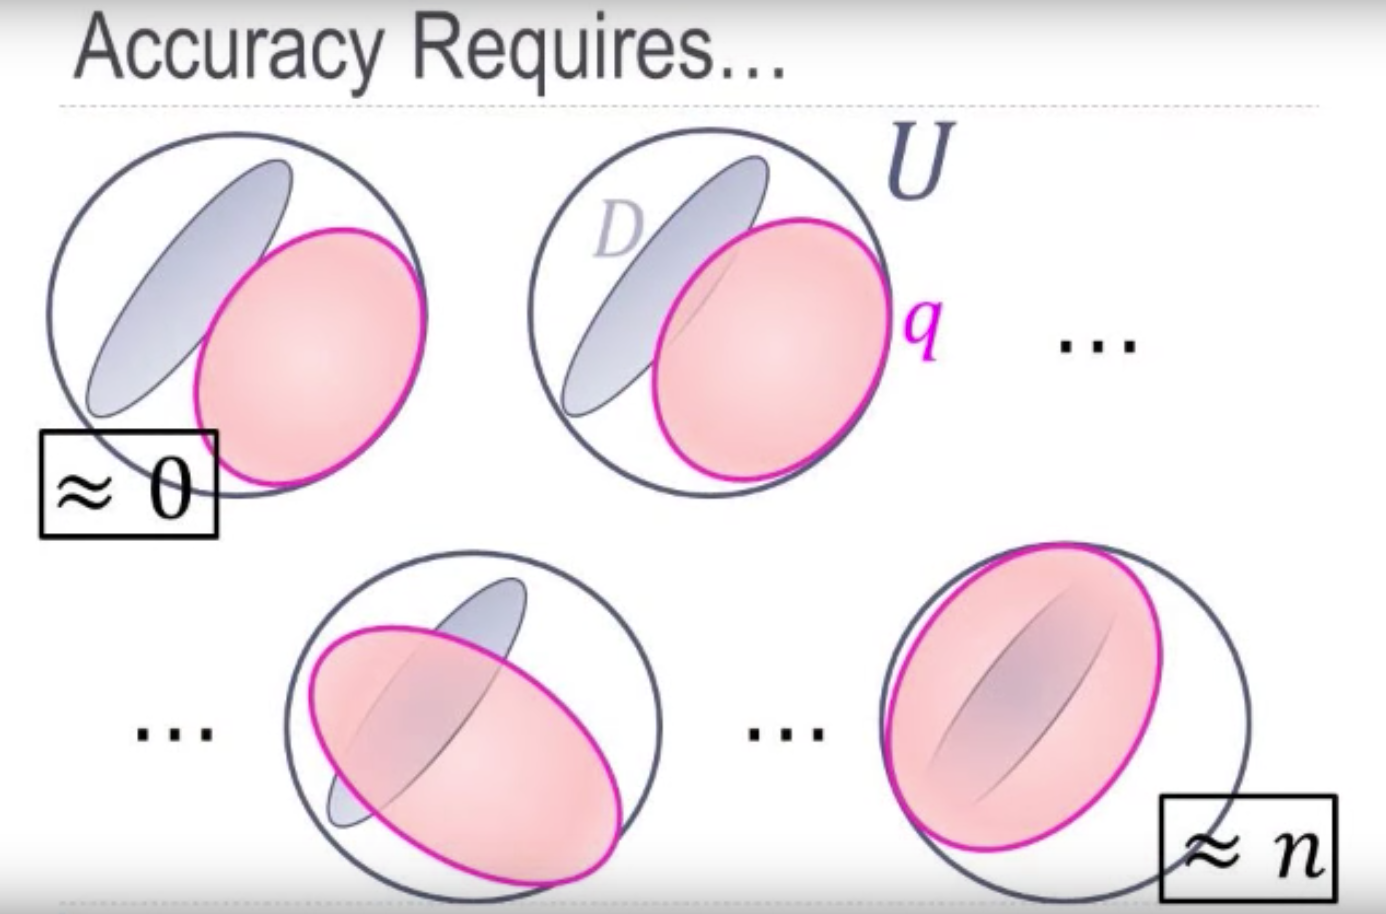
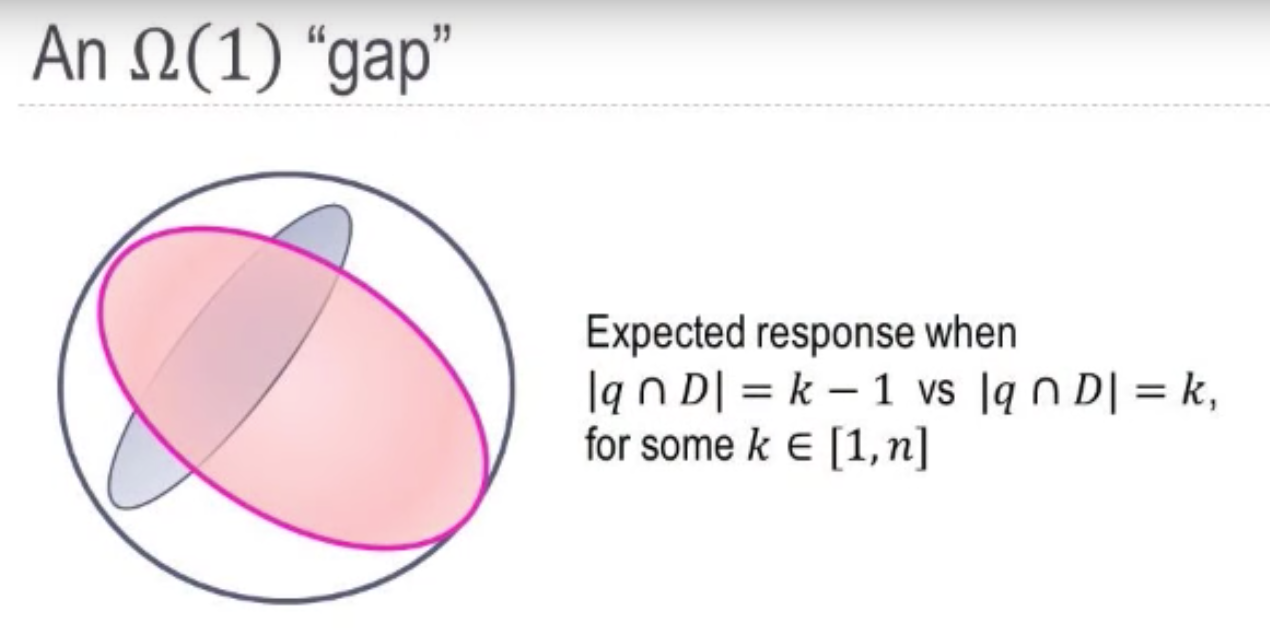
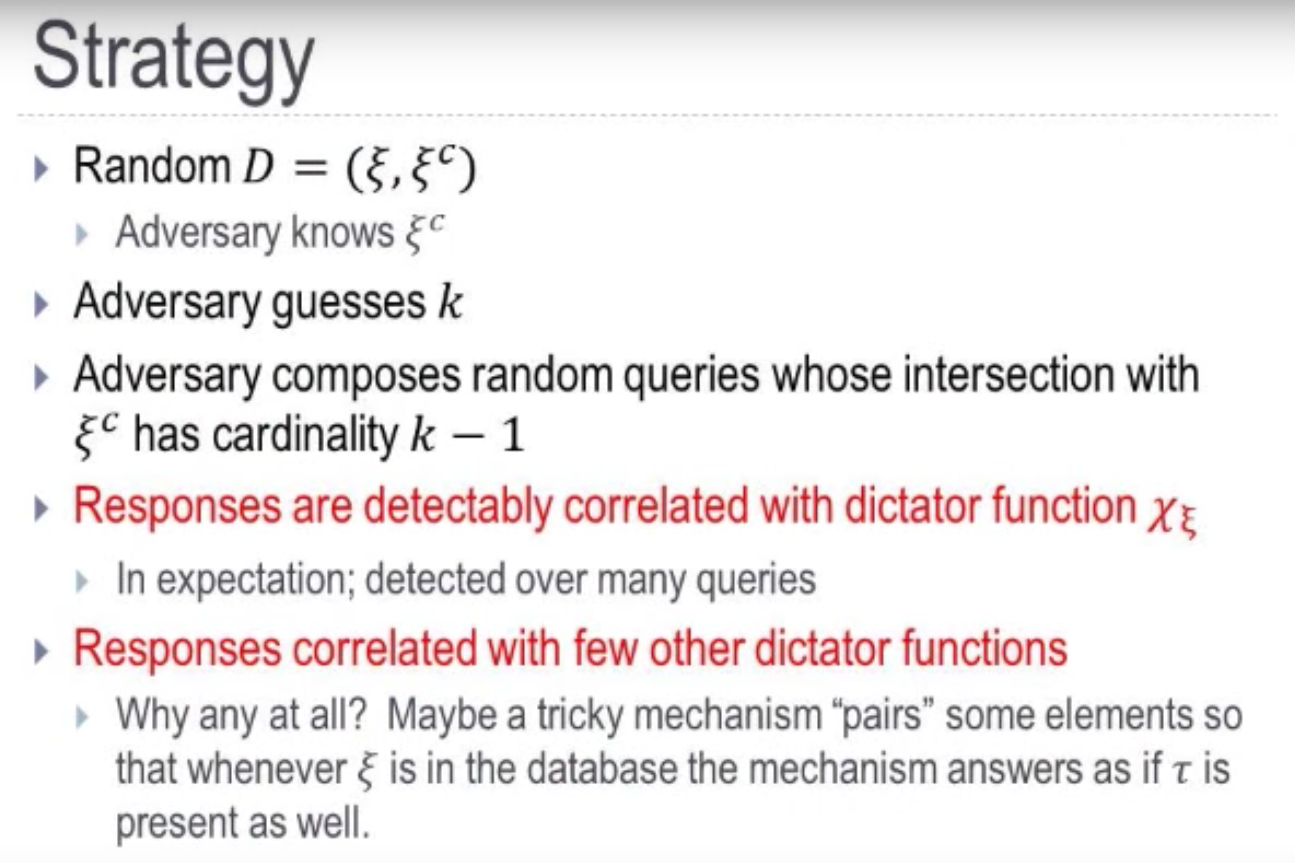
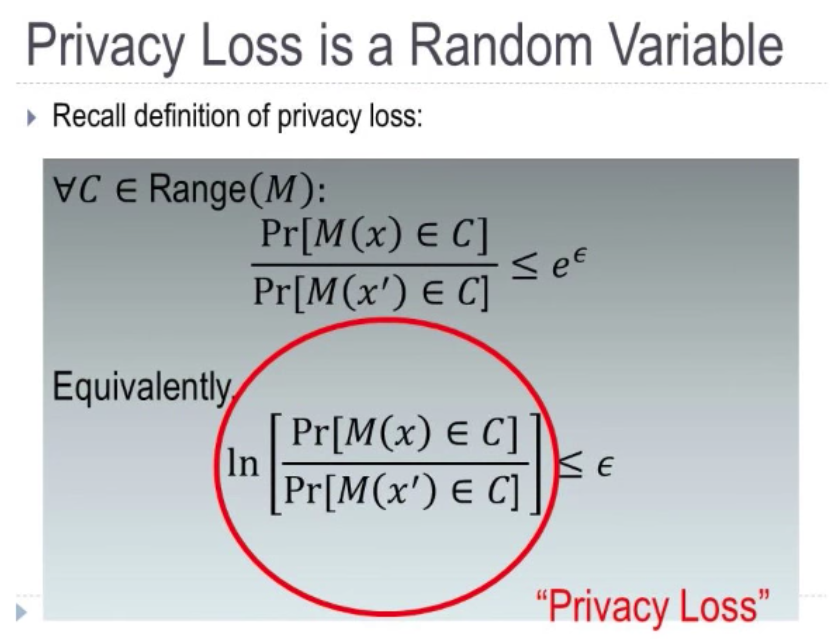
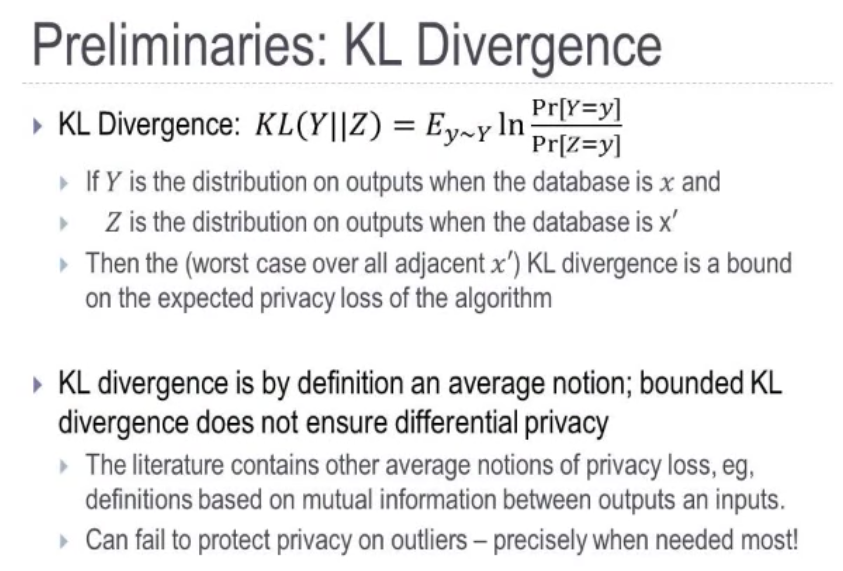
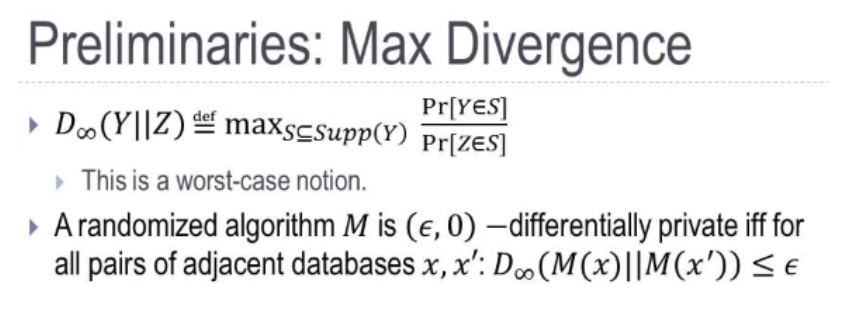
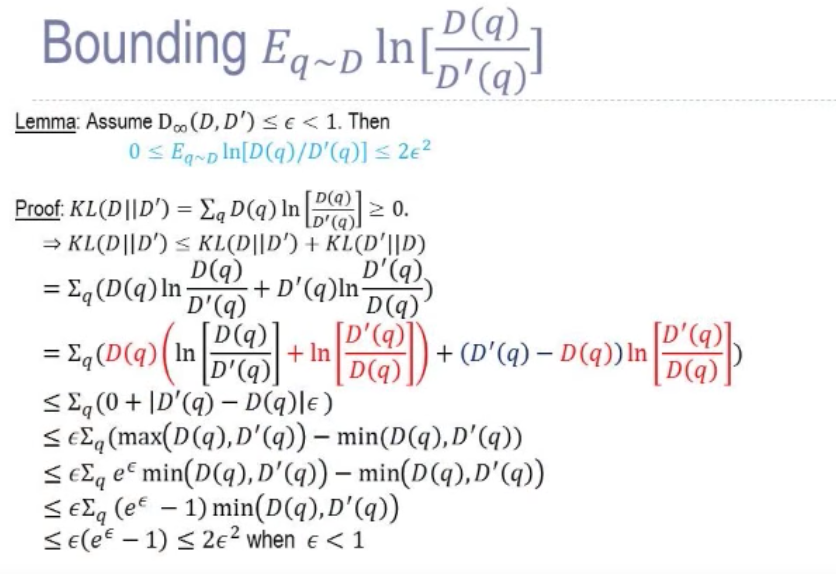
- $D(q)$ is the probability so is bounded by 1.
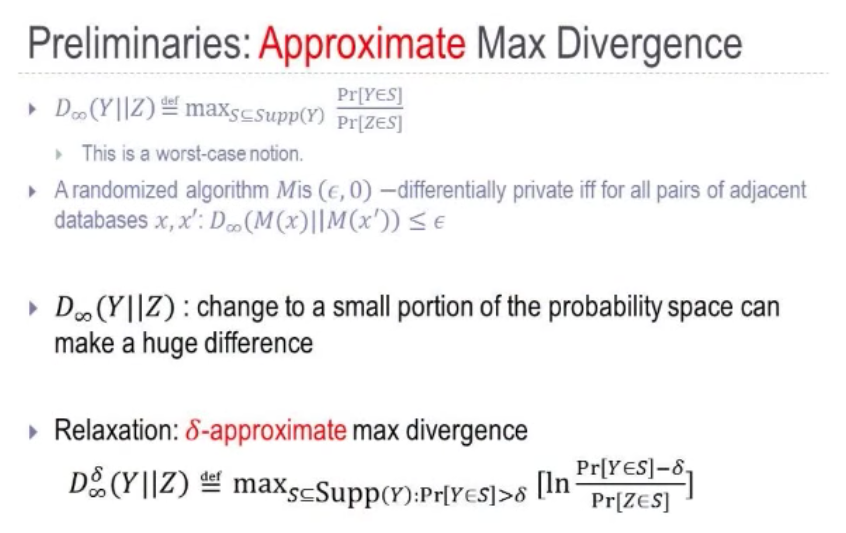
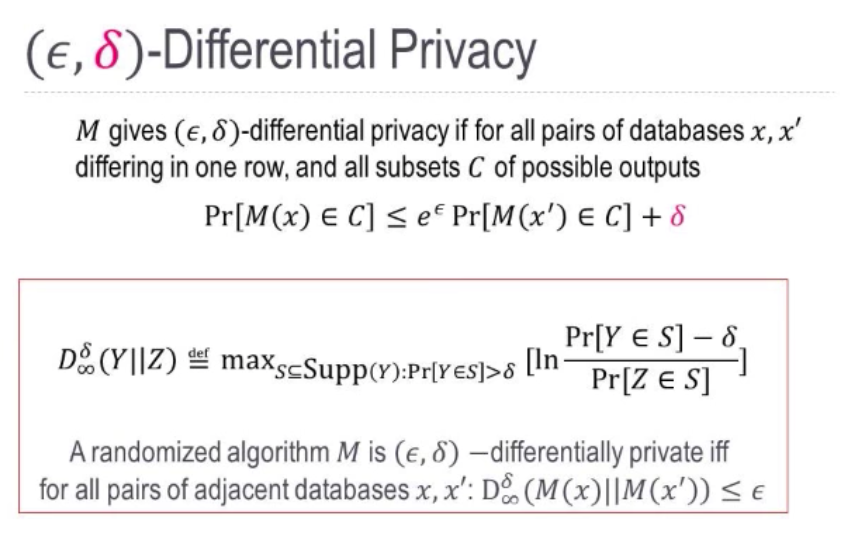
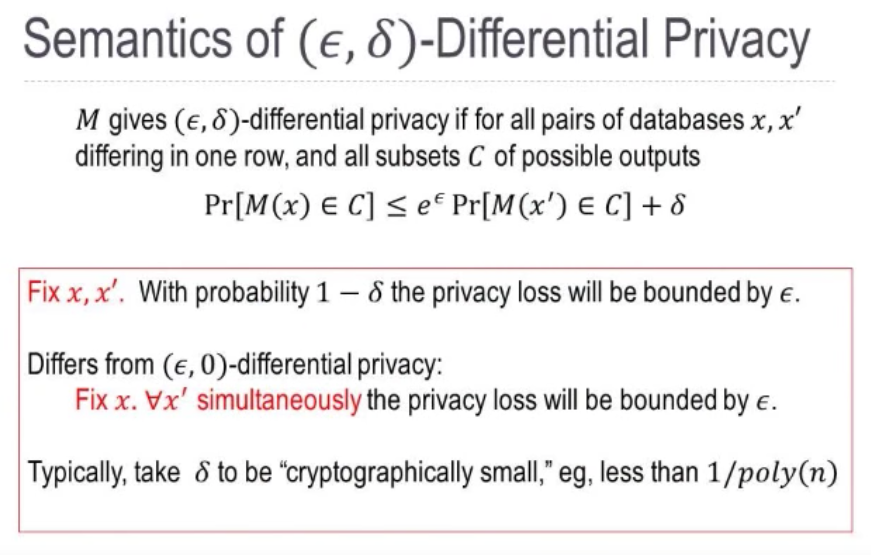
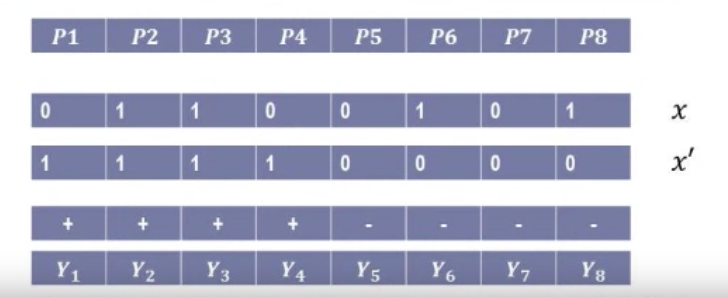
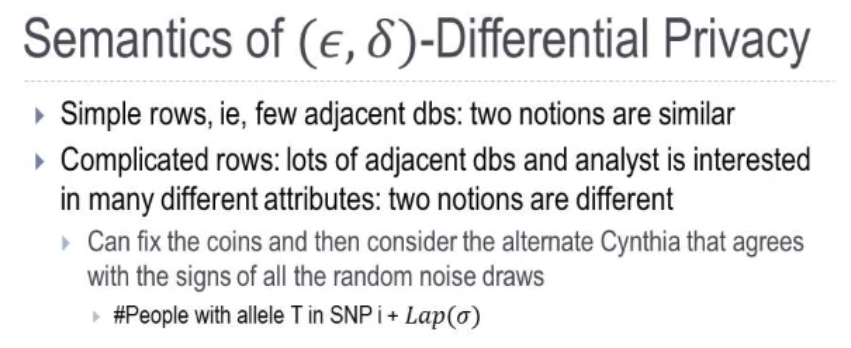
- There are two databases $x$ and $x’$, where $x$ has property $p2,p3,p6$ and $p8$ and $x’$ has property 1 through 4 but not 5 to 8. And we have a set of queries results $Y_i$ and say we release the result with some noise, where for $Y_1,Y_2,Y_3,Y_4$ we add positive noise while negative noise for $Y_5,Y_6,Y_7,Y_8$.
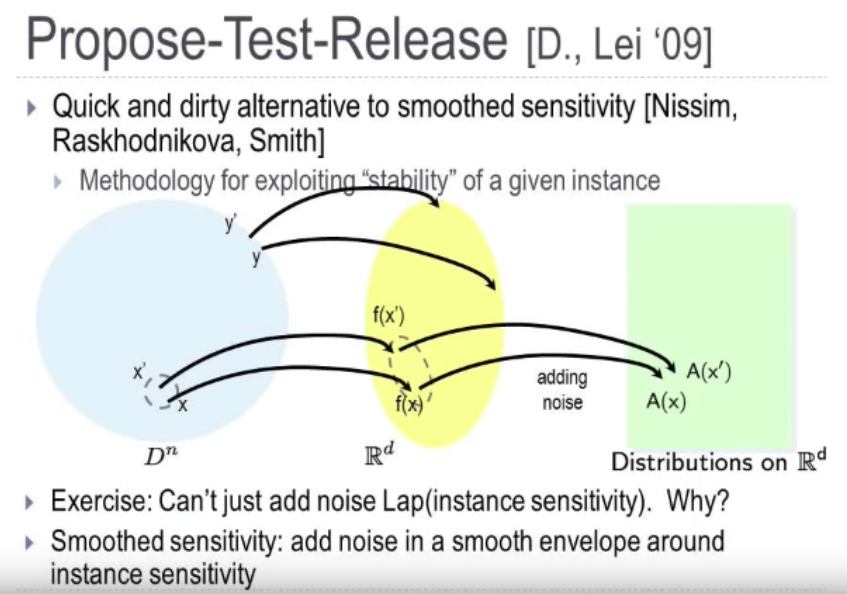
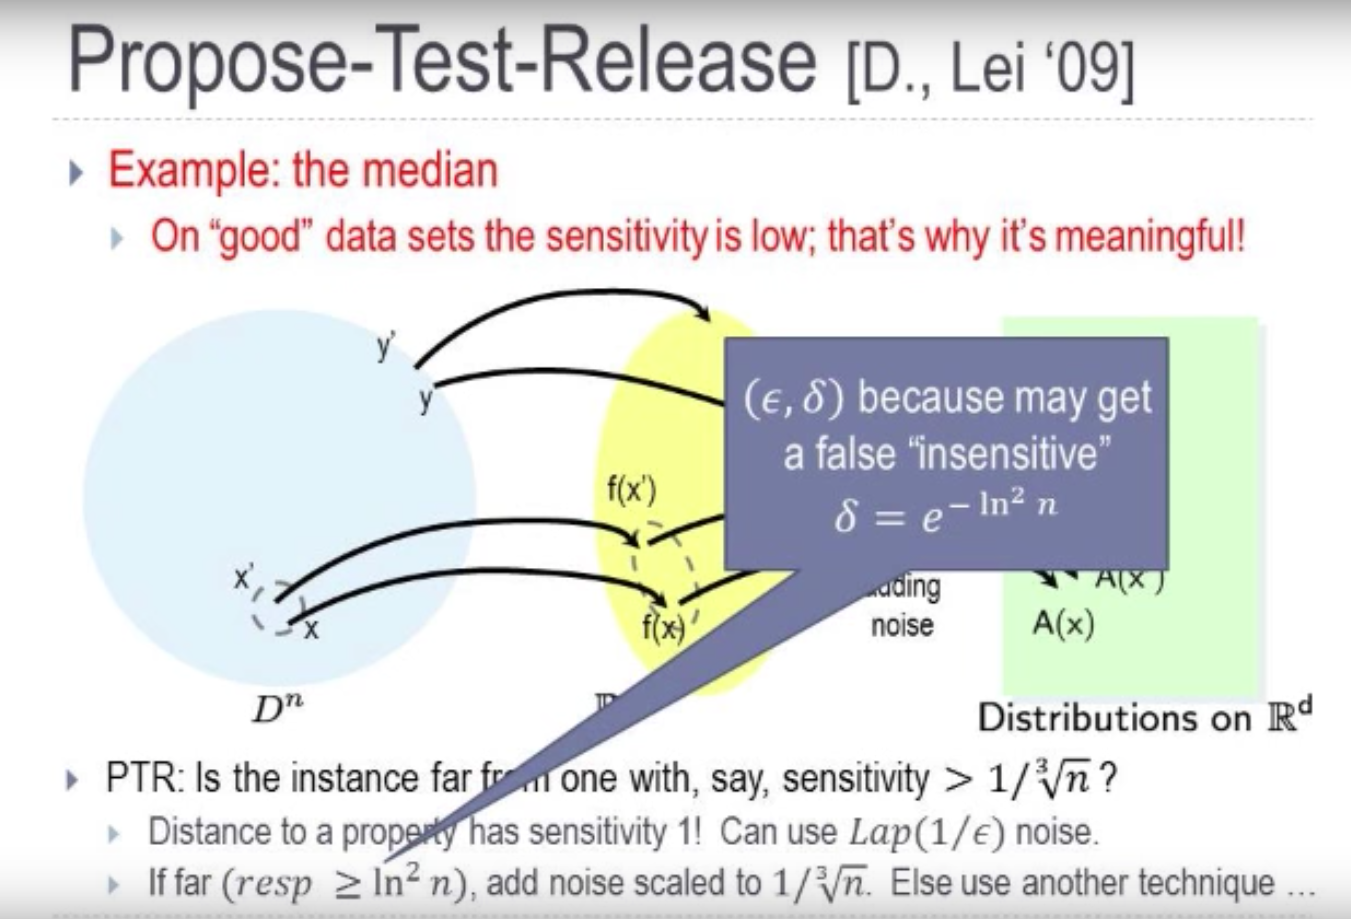
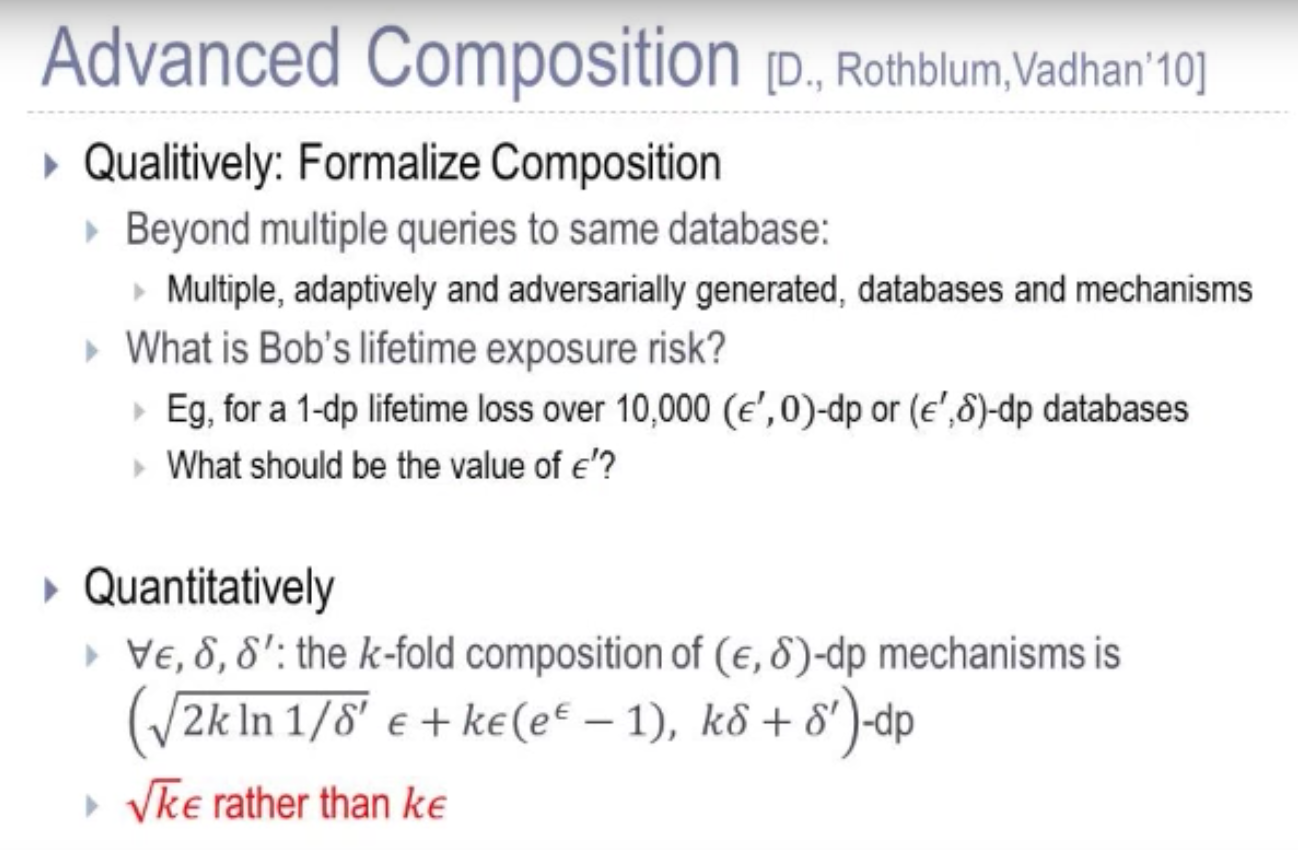
Deep learning is the process of learning nonlinear features and functions from complex data. Deep learning has been shown to outperform traditional techniques for speech recognition, image recognition, and face detection. Deep learning aims to extract complex features from high-dimensional data and use them to build a model that relates inputs to outputs (e.g., classes). Deep learning architectures are usually constructed as multi-layer networks so that more abstract features are computed as nonlinear functions of lower-level features.
Privacy in deep learning consists of three aspects: privacy of the data used for learning a model or as input to an existing model, privacy of the model, and privacy of the model’s output.
warning ignore
|
|
中文注释乱码
|
|
放在python脚本的第一行。
|
|
Python支持不同的数字类型 -
int (有符号整数): 它们通常被称为只是整数或整数,是正的或负的整数,没有小数点。 Python3整数是无限的大小。Python 2中有两个整数类型 - int 和 long。
在Python3中不再有 “长整型”了。
float (点实数值) : 也叫浮点数,它们代表实数,并用小数点分割整数和小数部分。浮点数也可以用科学记数法,使用 e 或 E 表示10的幂 (2.5e2 = 2.5 x 102 = 250).
complex (复数) : 格式是 a + bJ,其中a和b是浮点数,而J(或j)代表-1的平方根(这是一个虚数)。 实数是a的一部分,而虚部为b。复数不经常使用在 Python 编程了。
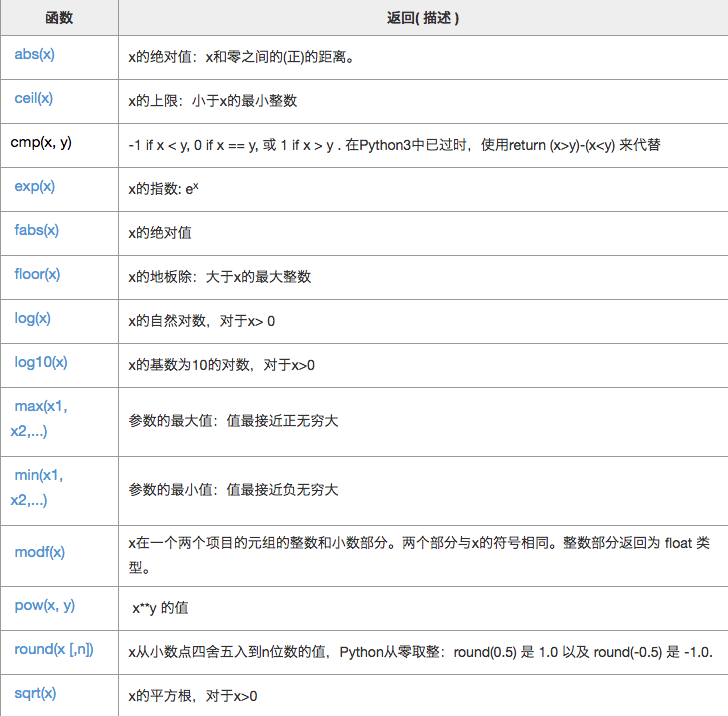
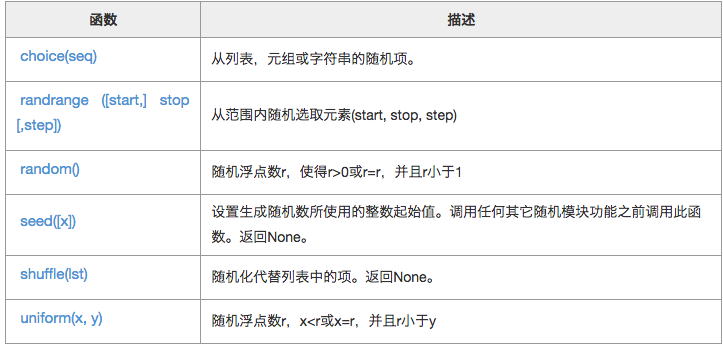
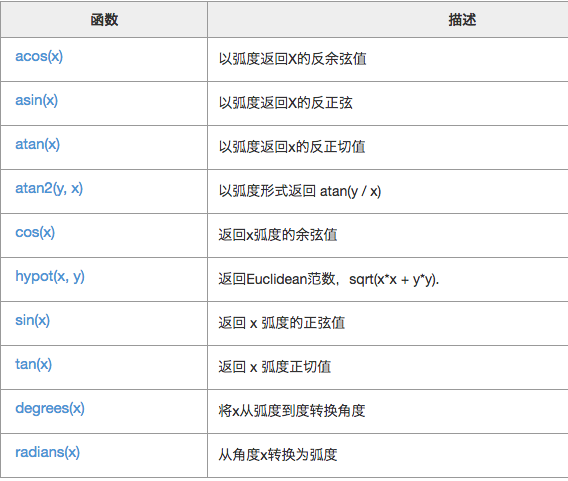
以下是 choice() 方法的语法:
|
|
|
|
randrange()方法的语法:
|
|
返回范围[0,1]内的随机值
|
|
|
|
|
|

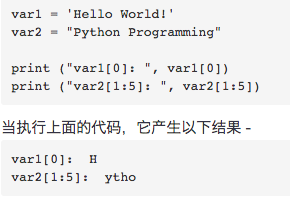
要访问子字符串,用方括号以及索引或索引来获得子切片
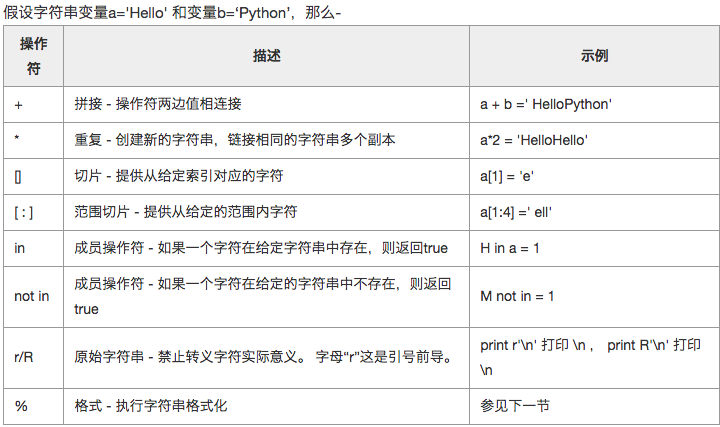
字符串是常量,不能直接修改,但是可以通过字符串拼接,修改。
|
|
|
|
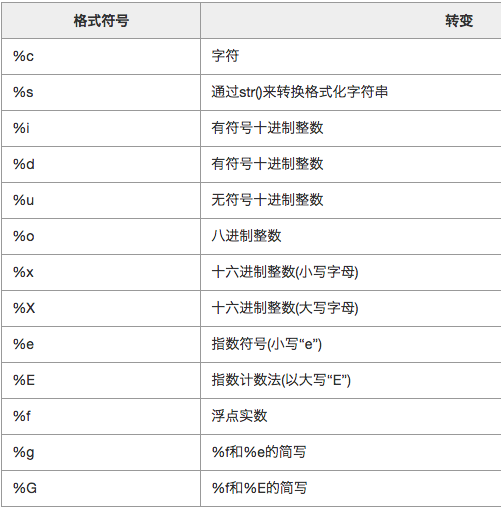
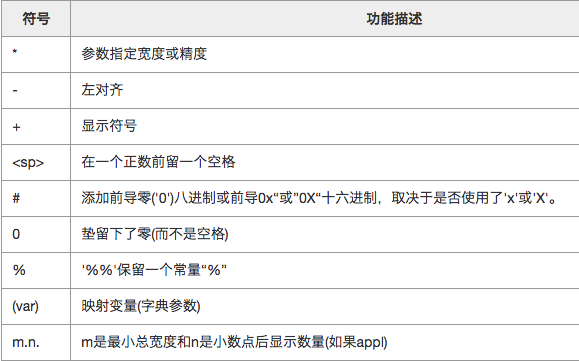
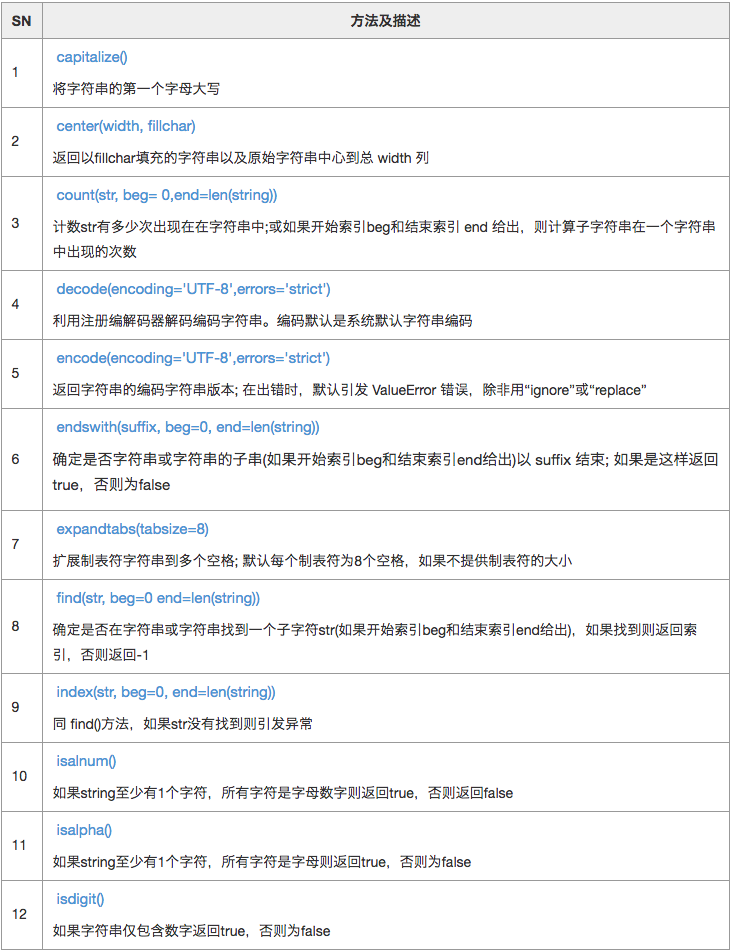
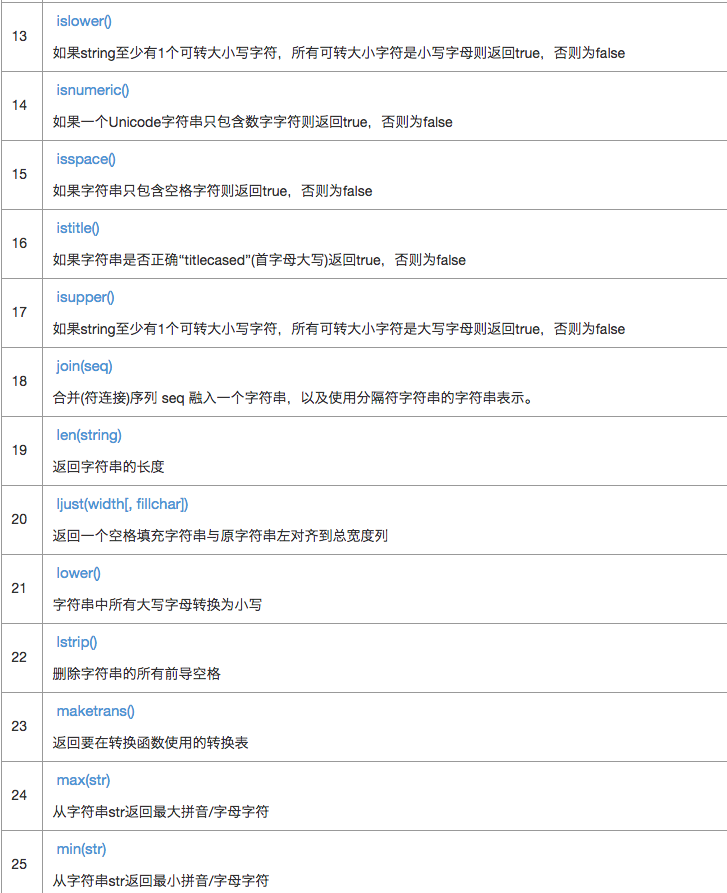
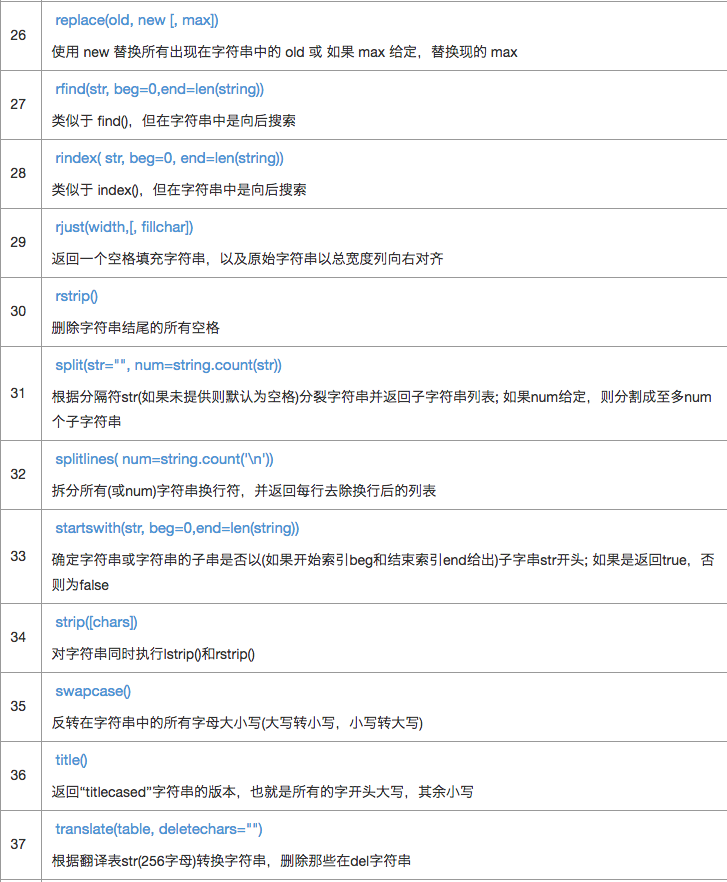

逗号分隔列表中元素,列表重要的一点是,在列表中的项目不必是同一类型。
|
|
与字符串索引类似,列表的索引从0开始,并列出可切片,联接,等等。
要访问列表值,请使用方括号连同索引或索引切片获得索引对应可用的值。例如 -
|
|
当执行上面的代码,它产生以下结果 -
|
|
可以通过给赋值运算符到左侧切片更新列表中的单个或多个元素, 并且可以使用 append()方法中加入一元素。例如 -
|
|
当执行上面的代码,它产生以下结果 -
|
|
|
|
|
|

| 函数名 | 功能描述 |
|---|---|
| cmp(list1, list2) | 列表元素比较,返回0,1,-1, |
| len(list) | 列表长度 |
| max(list) | 返回列表中最大值 |
| min(list) | 列表中最小值 |
| list(seq) | 转化为list |
| append(ele) | 元素添加到列表 |
| count(ele) | 统计元素在列表中出现次数 |
| extend(list) | 合并list |
| index(ele) | 返回列表中 ele 对象对应最低索引值 |
| insert(index, ele) | 插入 ele 对象到列表的 index 索引位置,index必须给出 |
| pop([index=-1]) | 根据index删除元素,默认删除最后一个 |
| remove(ele) | 删除ele元素 |
| reverse() | 列表翻转 |
| sort() | 列表元素排序 |
|
|
|
|
|
|
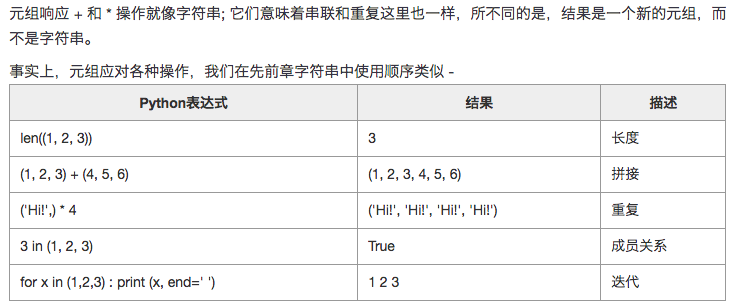
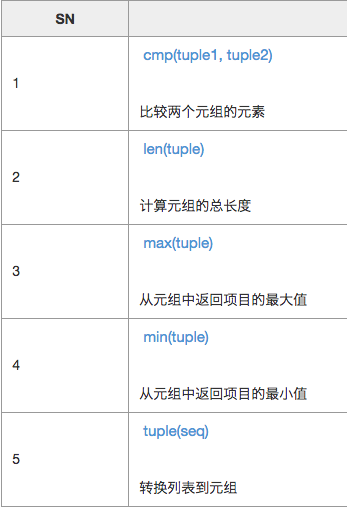
元组是不可变的Python对象的序列,元组序列就像列表,元组和列表之间的区别是,元组不像列表那样不能被改变以及元组使用圆括号,而列表使用方括号,创建一个元组是将不同的逗号分隔值。
|
|
为了编写含有一个单一的值,必须包含逗号,即使只有一个值的元组 −
|
|
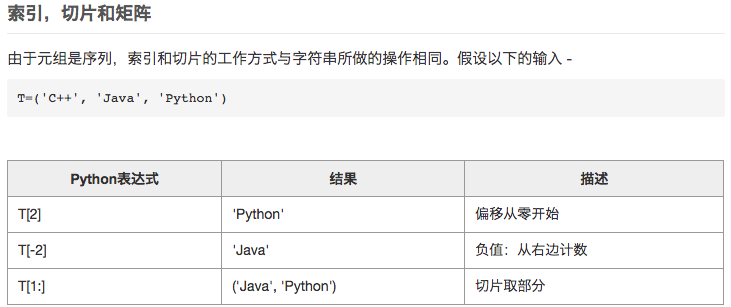
要访问值元组,用方括号带索引或索引切片来获得可用的索引值
|
|
元组是不可变的,这意味着我们不可以更新或更改元组元素的值。如下面的例子说明了可以把现有的元组创建新的元组的部分
|
|
移除个元组的别元素是不可能的。如要明确删除整个元组,只需要用 del 语句。
|
|
每个键是从它的值由冒号(:),即在项目之间用逗号隔开,整个东西是包含在大括号中。没有任何项目一个空字典只写两个大括号,就像这样:{}.
键在一个字典中是唯一的,而值则可以重复。字典的值可以是任何类型,但键必须是不可变的数据的类型,例如:字符串,数字或元组这样的类型。
要访问字典元素,你可以使用方括号和对应键,以获得其对应的值。
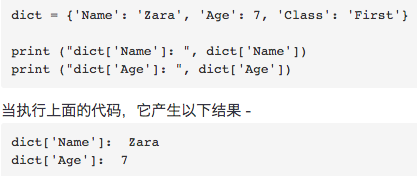
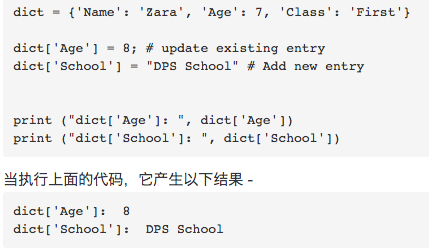
可以通过添加新条目或键值对,修改现有条目,或删除现有条目
可以删除单个字典元素或清除字典的全部内容。也可以在一个单一的操作删除整个词典。
要明确删除整个词典,只要用 del 语句就可以做到。

每个键对应多个条目是不允许的。这意味着重复键是不允许的。当键分配过程中遇到重复,以最后分配的为准。例如 -
|
|
键必须是不可变的。这意味着可以使用字符串,数字或元组作为字典的键,但是像[‘key’]是不允许的。
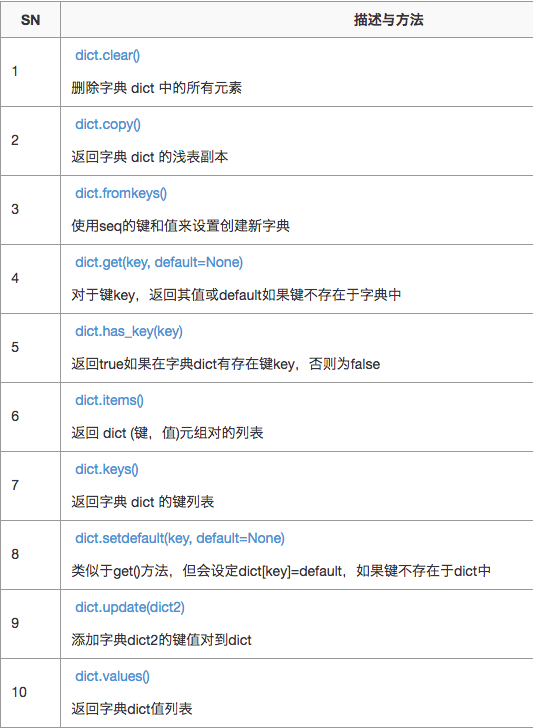
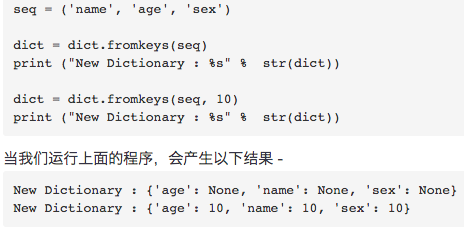
fromkeys()
使用seq的值作为键,来设置创建新的字典。
|
|
参数
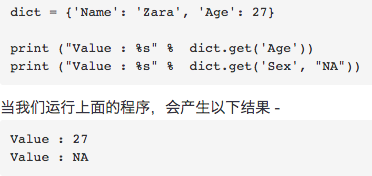
get()
返回给定键的值。如果键不可用,那么返回默认值 - None。
|
|
参数
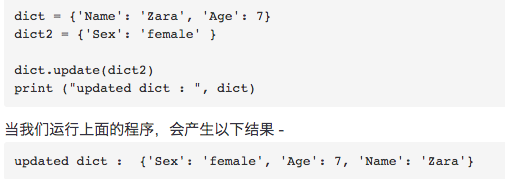
update()
添加字典dict2键值对到字典dict
箱线图(Boxplot)也称箱须图(Box-whisker Plot),可以用于异常值检测。它是用一组数据中的最小值、第一四分位数、中位数、第三四分位数和最大值来反映数据分布的中心位置和散布范围,可以粗略地看出数据是否具有对称性。通过将多组数据的箱线图画在同一坐标上,则可以清晰地显示各组数据的分布差异,为发现问题、改进流程提供线索。
所谓四分位数,就是把组中所有数据由小到大排列并分成四等份,处于三个分割点位置的数字就是四分位数。
确定Q1、Q2、Q3的位置(n表示数字的总个数)
对于数字个数为奇数的,其四分位数比较容易确定。例如,数字“5、47、48、15、42、41、7、39、45、40、35”共有11项,由小到大排列的结果为“5、7、15、35、39、40、41、42、45、47、48”,计算结果如下:
而对于数字个数为偶数的,其四分位数确定起来稍微繁琐一点。例如,数字“8、17、38、39、42、44”共有6项,位置计算结果如下:
这时的数字以数据连续为前提,由所确定位置的前后两个数字共同确定。例如,Q2的位置为3.5,则由第3个数字38和第4个数字39共同确定,计算方法是:38+(39-38)×3.5的小数部分,即38+1×0.5=38.5。该结果实际上是38和39的平均数。
同理,Q1、Q3的计算结果如下:
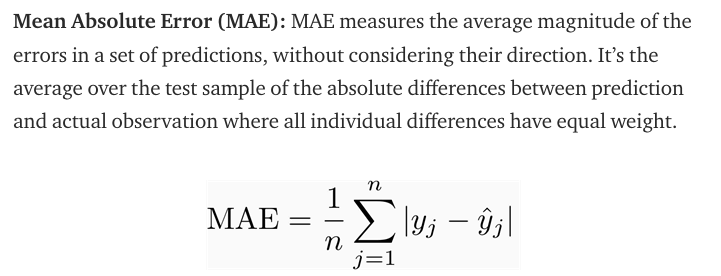
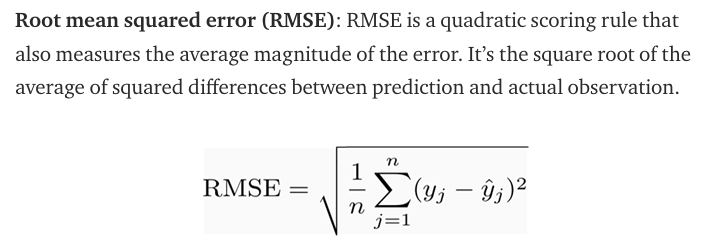
They are both used in crowd counting as evaluation metric.
Roughly speaking, MAE indicates the accuracy of the estimates, and MSE indicates the robustness of the estimates.
This is because for mse, the errors are squared before they are averaged, the MSE gives a relatively high weight to large errors. This means the RMSE should be more useful when large errors are particularly undesirable.
A confusion matrix is a technique used for summarizing the performance of a classification algorithm i.e. it has binary outputs. Example for a classification algorithm: Predicting if the patient has cancer. Here, there can only be two outputs i.e. Yes or No.
A confusion matrix gives us a better idea of what our classification model is predicting right and what types of errors it is making.
Below is what an Confusion Matrix looks like:
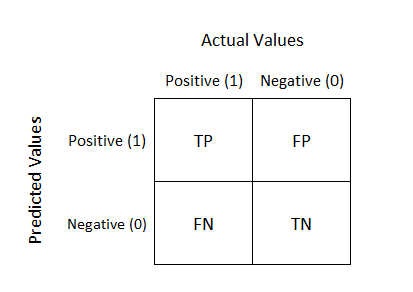
True Positive: You predicted positive and your are right.
True Negative: You predicted negative and your are right.
False Positive: (Type 1 Error): You predicted positive and you are wrong.
False Negative: (Type 2 Error): You predicted negative and you are wrong.
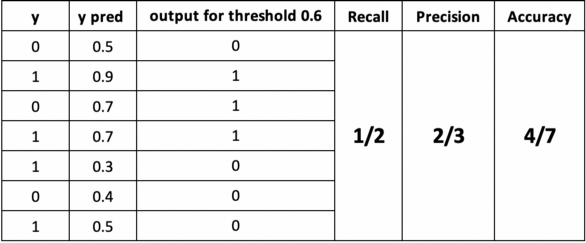
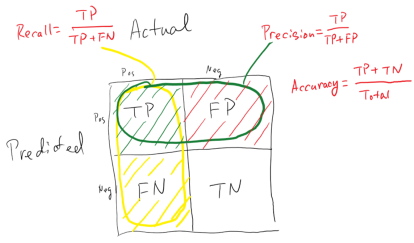
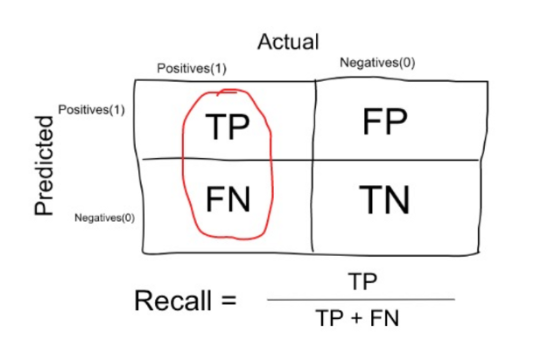
Recall
Among the data with label 1, what is the percentage of them predicted as 1?
Precision
Among the data predicted as 1, what is the percenatge of correctness?
F-measure
accuracy常用于分类,比对两个向量,一个是真实向量,一个是预测向量,预测正确加1,最终sum除以向量长度就是准确率。
精确率(precision)的公式是katex is not defined,它计算的是所有”正确被检索的item(TP)”占所有”实际被检索到的(TP+FP)”的比例.(在所有找对找错里面,找对的概率)
召回率(recall)的公式是katex is not defined,它计算的是所有”正确被检索的item(TP)”占所有”应该检索到的item(TP+FN)”的比例。(找到正确的,能覆盖目标的所有的概率)
假如某个班级有男生80人,女生20人,共计100人.目标是找出所有女生. 现在某人挑选出50个人,其中20人是女生,另外还错误的把30个男生也当作女生挑选出来了. 作为评估者的你需要来评估(evaluation)下他的工作。
ROC (Receiver Operating Characteristic) Curve tells us about how good the model can distinguish between two things (e.g If a patient has a disease or no). Better models can accurately distinguish between the two. Whereas, a poor model will have difficulties in distinguishing between the two.
Let’s assume we have a model which predicts whether the patient has a particular disease or no. The model predicts probabilities for each patient (in python we use the“ predict_proba*” function*). Using these probabilities, we plot the distribution as shown below:
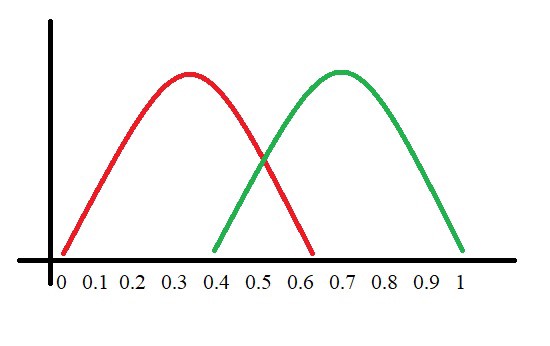
Here, the red distribution represents all the patients who do not have the disease and the green distribution represents all the patients who have the disease.
Now we got to pick a value where we need to set the cut off i.e. a threshold value, above which we will predict everyone as positive (they have the disease) and below which will predict as negative (they do not have the disease). We will set the threshold at “0.5” as shown below:
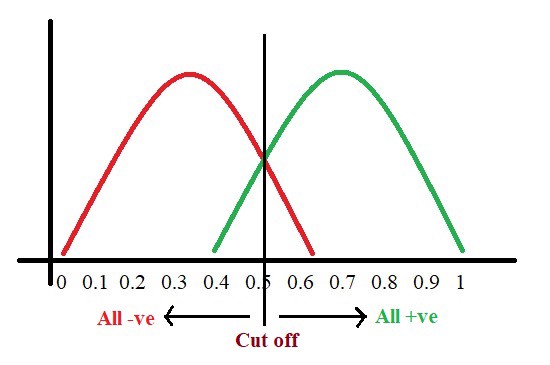
All the positive values above the threshold will be “True Positives” and the negative values above the threshold will be “False Positives” as they are predicted incorrectly as positives.
All the negative values below the threshold will be “True Negatives” and the positive values below the threshold will be “False Negative” as they are predicted incorrectly as negatives.
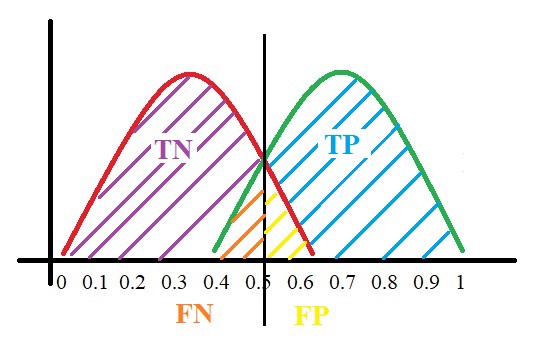
Here, we have got a basic idea of the model predicting correct and incorrect values with respect to the threshold set. Before we move on, let’s go through two important terms: Sensitivity and Specificity.
In simple terms, the proportion of patients that were identified correctly to have the disease (i.e. True Positive) upon the total number of patients who actually have the disease is called as Sensitivity or Recall.
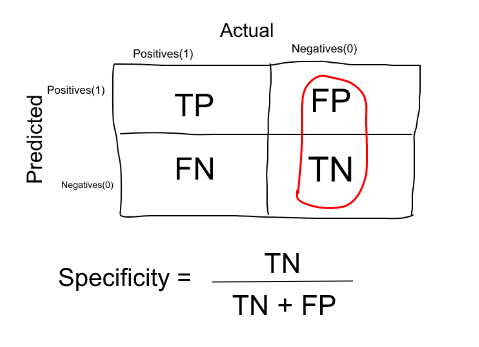
Similarly, the proportion of patients that were identified correctly to not have the disease (i.e. True Negative) upon the total number of patients who do not have the disease is called as Specificity.
When we decrease the threshold, we get more positive values thus increasing the sensitivity. Meanwhile, this will decrease the specificity.
Similarly, when we increase the threshold, we get more negative values thus increasing the specificity and decreasing sensitivity.
As Sensitivity ⬇️ Specificity ⬆️
As Specificity ⬇️ Sensitivity ⬆️
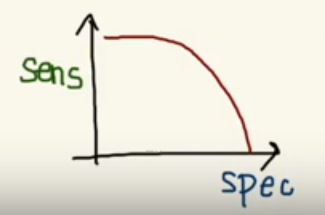
But, this is not how we graph the ROC curve. To plot ROC curve, instead of Specificity we use (1 — Specificity) and the graph will look something like this:
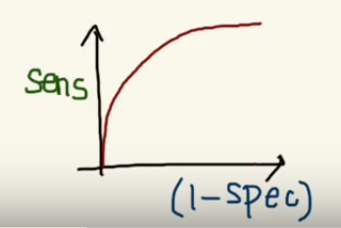
So now, when the sensitivity increases, (1 — specificity) will also increase. This curve is known as the ROC curve.
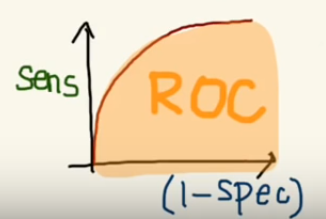
The AUC is the area under the ROC curve. This score gives us a good idea of how well the model performances.
Let’s take a few examples
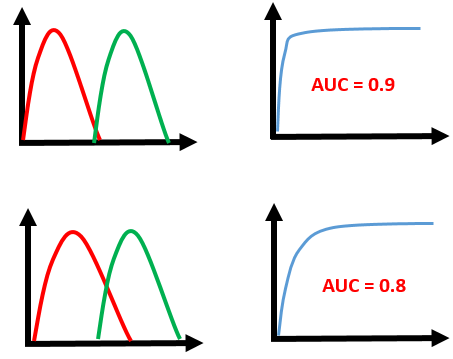
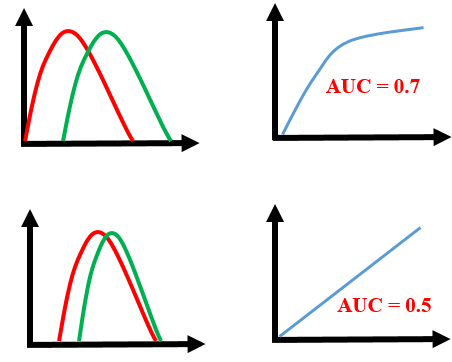
As we see, the first model does quite a good job of distinguishing the positive and the negative values. Therefore, there the AUC score is 0.9 as the area under the ROC curve is large.
Whereas, if we see the last model, predictions are completely overlapping each other and we get the AUC score of 0.5. This means that the model is performing poorly and it is predictions are almost random.
Let’s derive what exactly is (1 — Specificity):
As we see above, Specificity gives us the True Negative Rate and (1 — Specificity) gives us the False Positive Rate.
So the sensitivity can be called as the “True Positive Rate” and (1 — Specificity) can be called as the “False Positive Rate”.
So now we are just looking at the positives. As we increase the threshold, we decrease the TPR as well as the FPR and when we decrease the threshold, we are increasing the TPR and FPR.
Thus, AUC ROC indicates how well the probabilities from the positive classes are separated from the negative classes.
AOC是衡量一个模型是否有效的参数,比如:我们使用了grid search来暴力寻找最佳的超参数组合,我们就可以使用AOC来比较不同超参数组合模型的效果,从而选择最佳模型的超参数组合。一般将scoring=’roc_auc’。
|
|
协同过滤推荐算法主要的功能是预测和推荐。算法通过对用户历史行为数据的挖掘发现用户的偏好,基于不同的偏好对用户进行群组划分并推荐品味相似的商品。协同过滤推荐算法分为两类,分别是基于用户的协同过滤算法(user-based collaboratIve filtering),和基于物品的协同过滤算法(item-based collaborative filtering)。简单的说就是:人以类聚,物以群分。
NumPy 是一个 Python 包。 它代表 “Numeric Python”。 它是一个由多维数组对象和用于处理数组的例程集合组成的库。
[ ] [Concentrated differential privacy: Simplifications, extensions, and lower bounds.]
[ ] [R’enyi differential privacy]